
FIGURE 1.
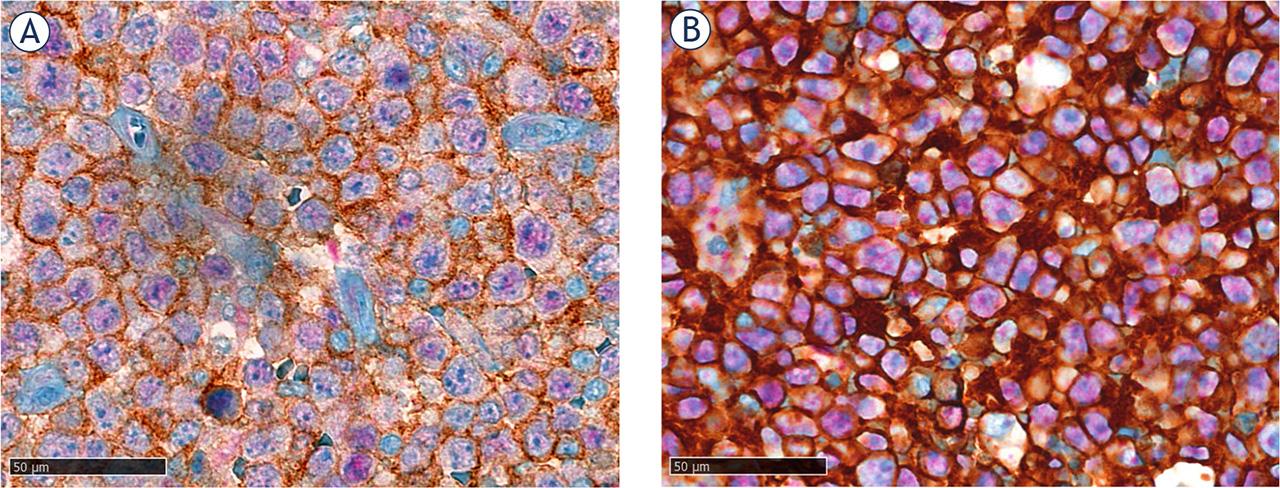
FIGURE 2.
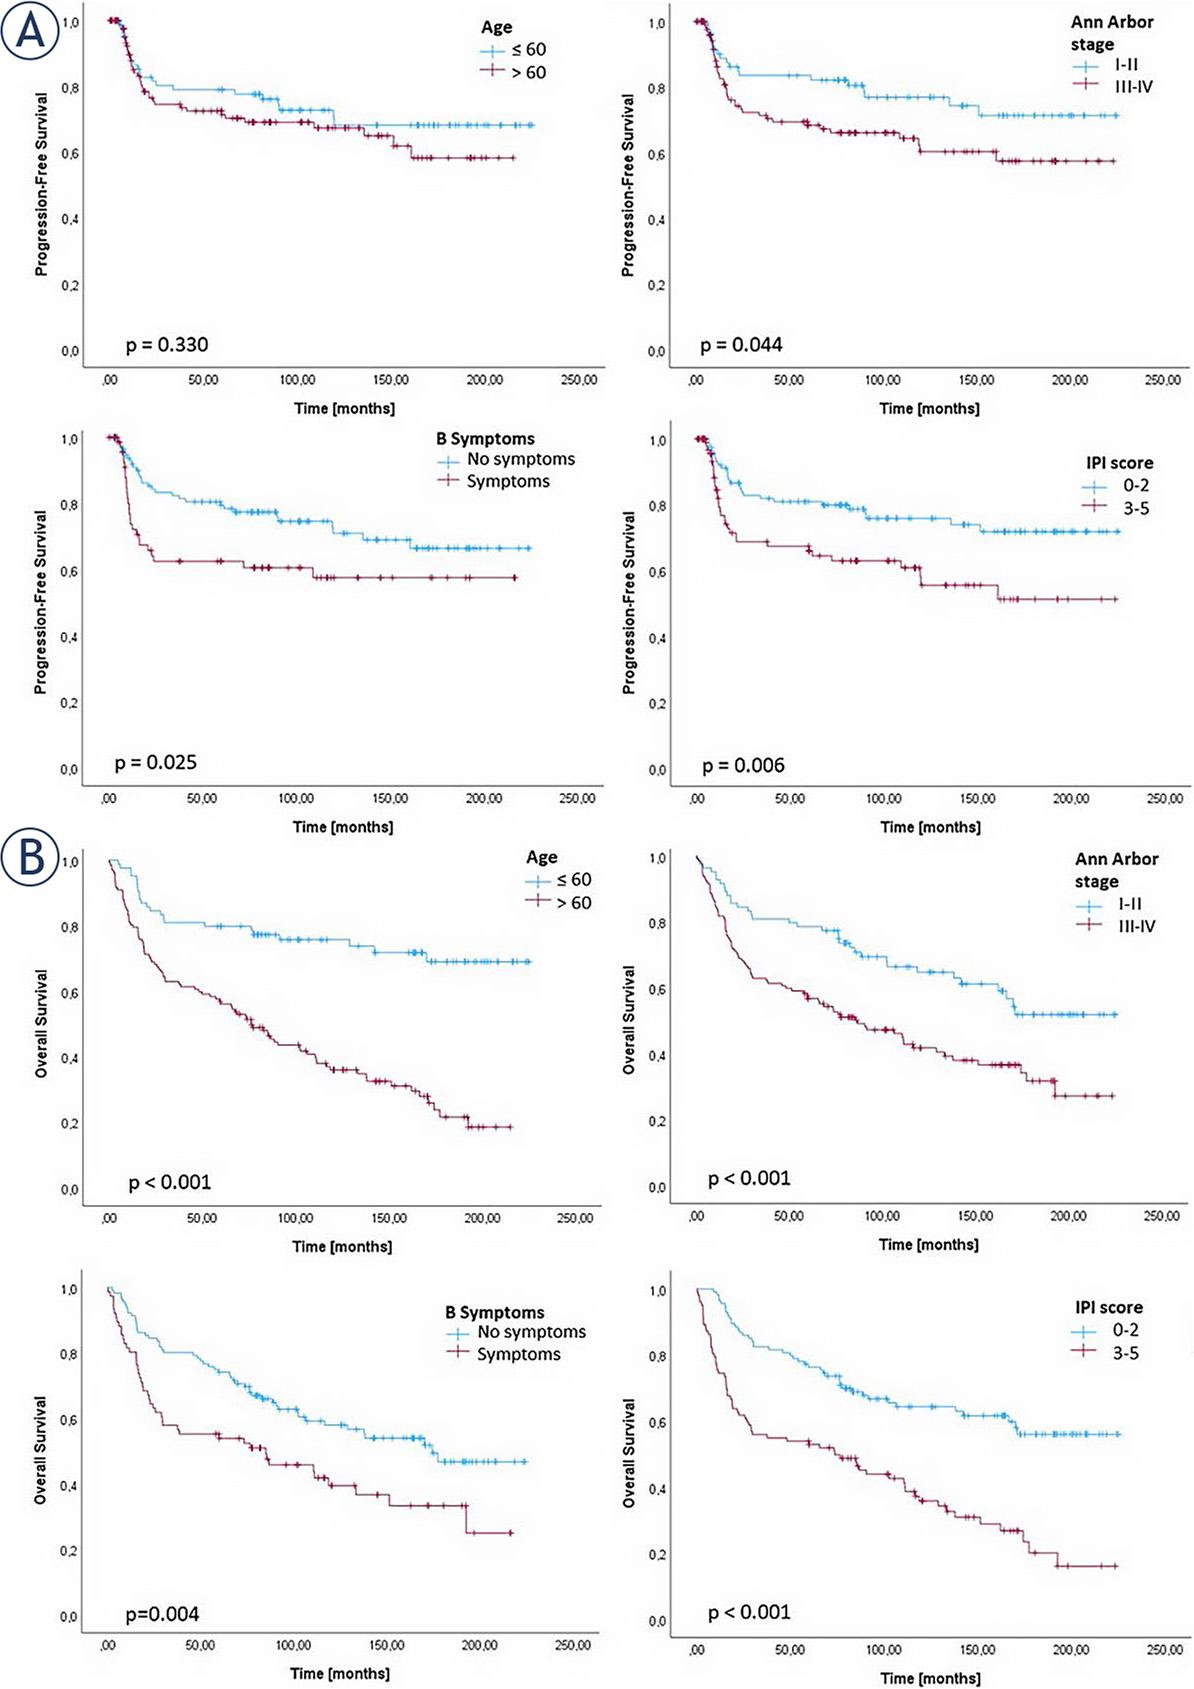
FIGURE 3.
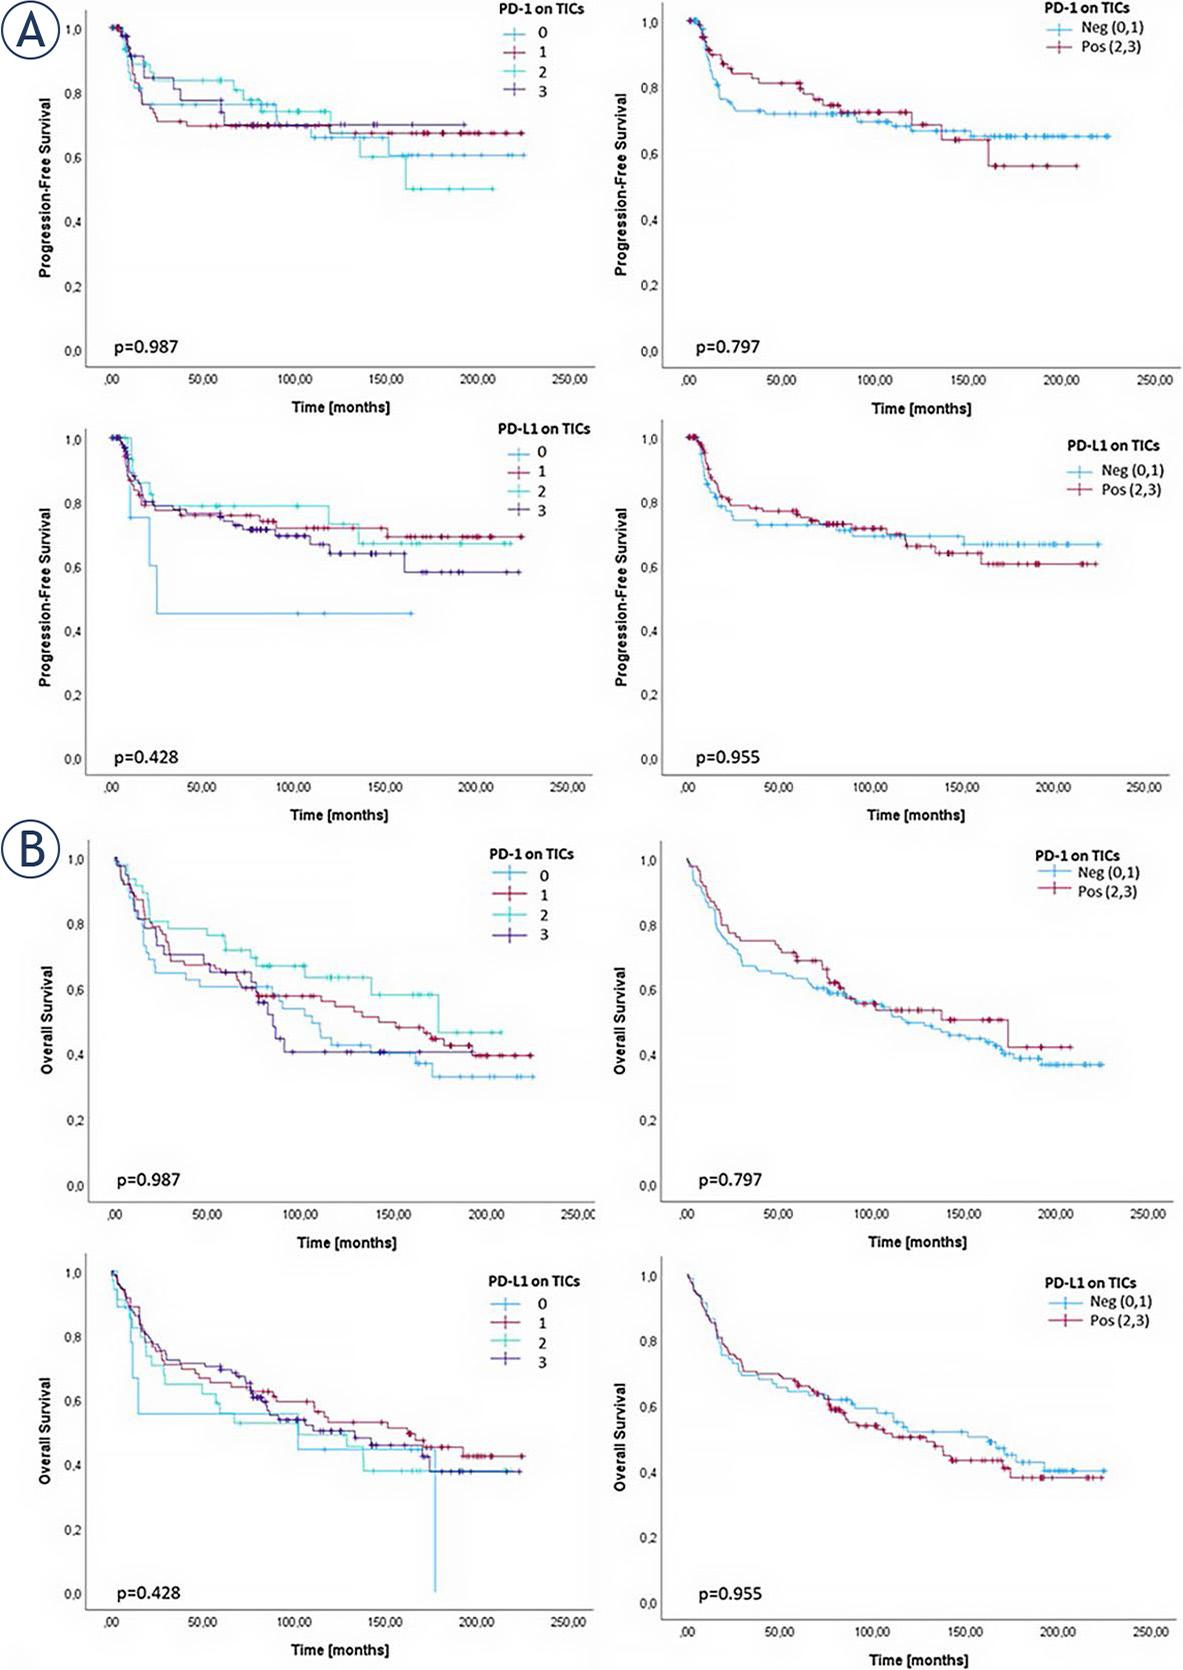
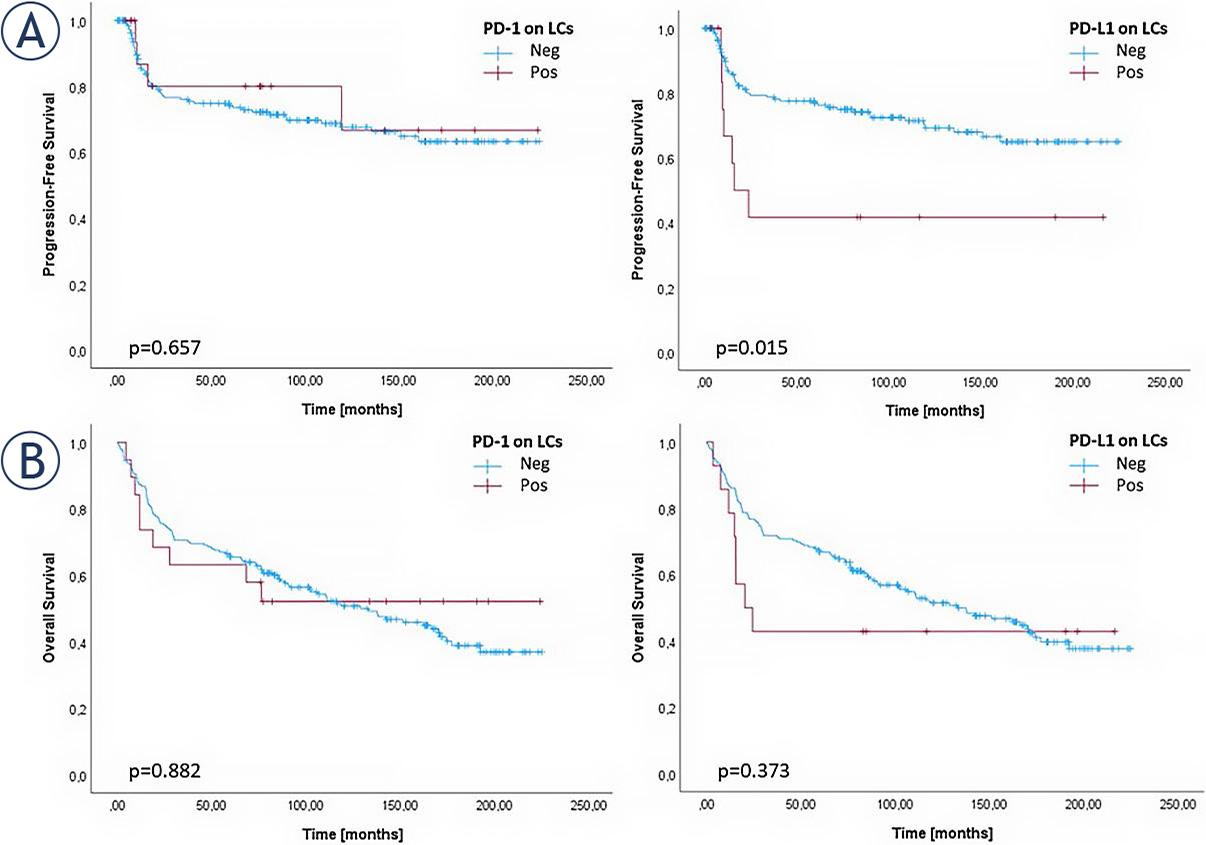
FIGURE 4.
PD-1 and PD-L1 expression in association with clinicopathological characteristics of patients with diffuse large B-cell lymphoma, not otherwise specified
| PD-1 expression on TICs | PD-1 expression on LCs | PD-L1 expression on TICs | PD-L1 expression on LCs | |||||||||
|---|---|---|---|---|---|---|---|---|---|---|---|---|
| [N, (%)] | Positive | Negative | p value | Positive | Negative | p value | Positive | Negative | p value | Positive | Negative | p value |
| Total | 83 (38.4) | 133 (61.6) | 19 (8.8) | 197 (91.2) | 135 (62.5) | 81 (37.5) | 14 (6.5) | 202 (93.5) | ||||
| Age | 0.775 | 0.466 | 0.885 | 0.406 | ||||||||
| ≤60 | 31 (14.4) | 53 (24.5) | 9 (4.2) | 75 (34.7) | 53 (24.5) | 31 (14.4) | 7 (3.2) | 77 (35.6) | ||||
| >60 | 52 (24.1) | 80 (37.0) | 10 (4.6) | 122 (56.5) | 82 (38.0) | 50 (23.1) | 7 (3.2) | 125 (57.9) | ||||
| Sex | 0.889 | 0.811 | 0.265 | 1.000 | ||||||||
| Male | 39 (18.1) | 65 (30.1) | 10 (4.6) | 94 (43.5) | 61 (28.8) | 43 (19.9) | 7 (3.2) | 97 (44.9) | ||||
| Female | 44 (20.4) | 68 (31.5) | 9 (4.2) | 103 (47.7) | 74 (34.2) | 38 (17.6) | 7 (3.2) | 1,5 (48.6) | ||||
| Ann Arbor stage | 1.000 | 1.000 | 0.116 | 0.134 | ||||||||
| I–II | 32 (14.8) | 52 (24.1) | 7 (3.2) | 77 (35.6) | 47 (21.8) | 37 (17.1) | 3 (1.4) | 81 (37.5) | ||||
| III–IV | 51 (23.6) | 81 (37.5) | 12 (5.6) | 120 (55.6) | 88 (40.7) | 44 (20.4) | 11 (5.1) | 121 (56.0) | ||||
| Involvement of an extranodal organ | 0.643 | 0.412 | 0.332 | 0.738 | ||||||||
| Yes | 33 (18.9) | 39 (22.3) | 8 (4.6) | 64 (36.6) | 44 (25.1) | 28 (16.0) | 3 (1.7) | 69 (39.4) | ||||
| No | 43 (24.6) | 60 (34.3) | 7 (4.0) | 96 (54.9) | 71 (40.6) | 32 (18.3) | 6 (3.4) | 97 (55.4) | ||||
| Involvement of spleen | 0.847 | 1.000 | 0.540 | 1.000 | ||||||||
| Yes | 15 (9.2) | 19 (11.7) | 3 (1.8) | 31 (19.0) | 25 (15.3) | 9 (5.5) | 1 (0.6) | 33 (20.2) | ||||
| No | 61 (37.4) | 68 (41.7) | 11 (6.7) | 118 (72.4) | 87 (53.4) | 42 (25.8) | 7 (4.3) | 122 (74.8) | ||||
| B symptoms | 0.366 | 0.598 | 0.536 | 0.085 | ||||||||
| Yes | 27 (14.1) | 49 (25.5) | 5 (2.6) | 71 (37.0) | 52 (27.1) | 24 (12.5) | 9 (4.7) | 67 (34.9) | ||||
| No | 50 (26.0) | 66 (34.4) | 11 (5.7) | 105 (54.7) | 73 (38.0) | 43 (22.4) | 5 (2.6) | 111 (57.8) | ||||
| IPI score | 0.780 | 0.228 | 0.575 | 1.000 | ||||||||
| 0–2 | 45 (20.8) | 69 (31.9) | 13 (6.0) | 101 (46.8) | 69 (31.9) | 45 (20.8) | 7 (3.2) | 107 (49.5) | ||||
| 3–5 | 38 (17.6) | 64 (29.6) | 6 (2.8) | 96 (44.4) | 66 (30.6) | 36 (16.7) | 7 (3.2) | 95 (44.0) | ||||
| Hans Algorithm classification | 0.258 | 0.224 | 0.887 | 0.047 | ||||||||
| Non-GCB | 31 (14.4) | 61 (28.2) | 11 (5.1) | 88 (37.5) | 58 (26.9) | 34 (15.7) | 10 (4.6) | 82 (38.0) | ||||
| GCB | 52 (24.1) | 72 (33.3) | 8 (3.7) | 116 (53.7) | 77 (35.6) | 47 (21.8)) | 4 (1.9) | 120 (55.6) | ||||
| Patients’ outcome | 0.124 | 0.639 | 0.779 | 0.788 | ||||||||
| Alive | 45 (20.8) | 57 (26.4) | 10 (4.6) | 92 (42.6) | 65 (30.1) | 37 (17.1) | 6 (2.8) | 96 (44.4) | ||||
| Dead | 38 (17.6) | 76 (35.2) | 9 (4.2) | 105 (48.6) | 70 (32.4) | 44 (20.4) | 8 (3.7) | 106 (49.1) | ||||
Description of the PAX5, PD-1 And PD-L1 antibodies and immunohistochemistry staining protocols
| Primary Ab | Clone | Vendor | Reaction type | Antigen retrieval [100°C] | Ab dilution | Ab incubation time [min] | IHC detection kit |
|---|---|---|---|---|---|---|---|
| PAX5 | SP34 | Ventana | Nuclear | CC1 56 min | RTU | 32 (37°C) | UltraView Universal Alkaline Phosphatase Red |
| PD-1 | NAT105 | Dako | Cytoplasmic, Membranous | CC1 88 min | 1:200 | 60 (37°C) | OptiView DAB |
| PD-L1 | SP263 | Ventana | Cytoplasmic, Membranous | CC1 64 min | RTU | 16 (37°C) | OptiView DAB |
Univariate and multivariate analysis of the patients’ survival based on their clinicopathological characteristics and PD-1 and PD-L1 expressions on lymphoma cells and tumor-infiltrating immune cells in tissue samples of diffuse large B-cell lymphoma, not otherwise specified
| Univariate analysis | Multivariate analysis | ||||||||
|---|---|---|---|---|---|---|---|---|---|
| PFS | OS | PFS | OS | ||||||
| p value | Median when patients have relapse [months] | p value | Median when patients died [months] | p value | HR (95% CI) | p value | HR (95% CI) | ||
| Age | ≤ 60 vs. > 60 | 0.330 | 91.8 vs. 59.7 | < 0.001 | 110.1 vs. 73.5 | < 0.001 | 2.907 (1.710–4.940) | ||
| Sex | Male vs. Female | 0.945 | 69.1 vs. 80.9 | 0.324 | 78.3 vs. 90.8 | ||||
| Ann Arbor stage | I–II vs. III–IV | 0.044 | 91.3 vs. 59.7 | < 0.001 | 113.8 vs. 72.0 | 0.845 | 1.072 (0.532–2.130) | 0.073 | 1.654 (0.955–2.865) |
| Involvement of an extranodal organ | (−) vs. (+) | 0.886 | 77.4 vs. 74.1 | 0.451 | 81.8 vs. 82.3 | ||||
| Involvement of the spleen | (−) vs. (+) | 0.915 | 69.9 vs. 81.8 | 0.844 | 80.1 vs. 81.8 | ||||
| B symptoms | (−) vs. (+) | 0.025 | 85.3 vs. 30.8 | 0.004 | 91.8 vs. 65.3 | 0.338 | 1.319 (0.748–2.326) | 0.170 | 1.354 (0.879–2.087) |
| IPI score | 0–2 vs. 3–5 | 0.006 | 88.8 vs. 29.3 | < 0.001 | 101.2 vs. 62.7 | 0.048 | 1.945 (1.005–3.767) | 0.494 | 1.205 (0.706–2.058) |
| Hans classification | Non-GCB vs. GCB | 0.914 | 66.5 vs. 80.7 | 0.095 | 77.6 vs. 85.9 | ||||
| PD-1 on TICs | (−) vs. (+) | 0.797 | 81.6 vs. 76.0 | 0.478 | 85.9 vs. 80.7 | ||||
| PD-1 on LCs | (−) vs. (+) | 0.657 | 77.8 vs. 76.0 | 0.882 | 84.9 vs. 76.3 | ||||
| PD-L1 on TICs | (−) vs. (+) | 0.955 | 85.9 vs. 76.2 | 0.623 | 111.0 vs. 79.2 | ||||
| PD-L1 on LCs | (−) vs. (+) | 0.015 | 77.7 vs. 15.6 | 0.373 | 85.1 vs. 22.3 | 0.034 | 2.393 (1.070–5.352) | ||
Clinicopathological characteristics of the Slovenian patient cohort (N = 216) included in the analysis
| PD-1 on TICs Expression | PD-1 on LCs Expression | PD-L1 on TICs Expression | PD-L1 on LCs Expression | |||||
|---|---|---|---|---|---|---|---|---|
| (N, %) | Positive | Negative | Positive | Negative | Positive | Negative | Positive | Negative |
| All cases (N = 216) | 83 | 133 | 19 | 197 | 135 | 81 | 14 | 202 |
| Non-GCB subtype (N = 92) | 31 (37.3) | 61 (45.9) | 11 (57.9) | 81 (41.1) | 58 (43.0) | 34 (42.0) | 10 (71.4) | 82 (40.6) |
| GCB subtype (N = 142) | 52 (62.7) | 72 (54.1) | 8 (42.1) | 116 (58.9) | 77 (57.0) | 47 (58.0) | 4 (28.6) | 120 (59.4) |
| Non-GCB versus GCB subtype (p value) | 0.258 | 0.224 | 0.887 | 0.047 | ||||