
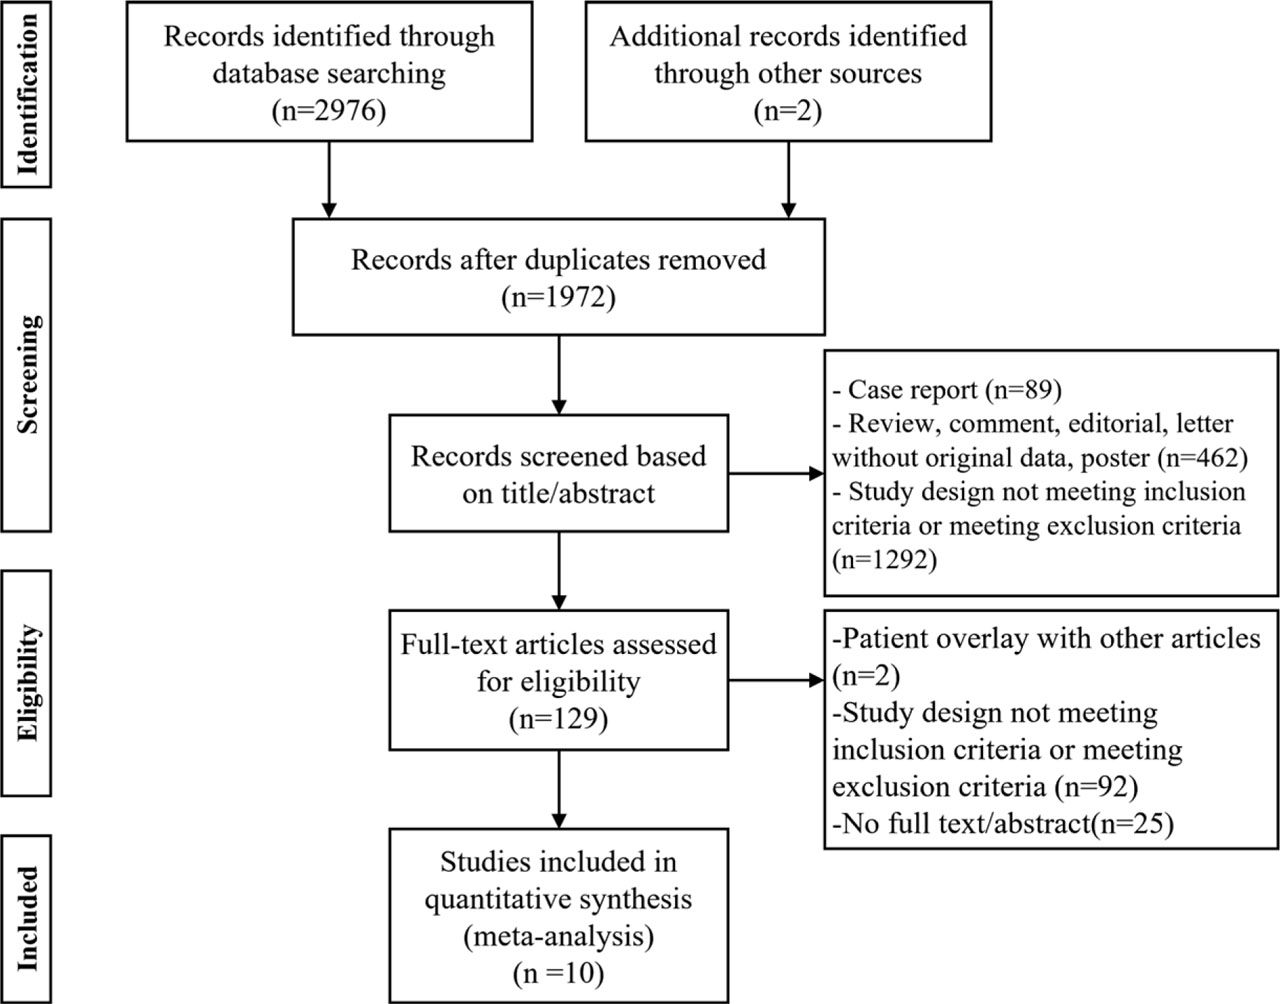
FIGURE 1.
Systematic Reviews and Meta-Analyses (PRISMA) flow chart.
TABLE 1.
Main study characteristics of included studies
| Study | Country | Treatment | Sample | Age (years) | Sex (F:M) | Outcomes | |||||
|---|---|---|---|---|---|---|---|---|---|---|---|
| LRT + ST | ST | LRT + ST | ST | LRT + ST | ST | LRT + ST | ST | ||||
| Yang, 202220 | China | ADT: DEB-TACE (Doxorubicin) | ICIs (Camrelizumab or Sintilimab) | Gemcitabine + Cisplatin | 20 | 20 | 59 | 59 | 9:11 | 7:13 | OS, PFS, ORR, AEs |
| Yan, 202221 | China | Ablation: RFA / MWA | Gemcitabine* | Gemcitabine* | 36 | 36 | NR | NR | 14:22 | 15:21 | OS |
| Sun, 202122 | China | ADT: TACI (5-Fluoruracil + cisplatin) | Gemcitabine + S-1 | Gemcitabine + Cisplatin + S-1 | 33 | 33 | NR | NR | NR | NR | OS, PFS, ORR, AEs |
| Gairing, 202123 | Germany | ADT: TACE (Mitomycin C / Doxorubicin) | Gemcitabine* | Gemcitabine* | 14 | 59 | 61.3 | 66.8 | 8:6 | 29:30 | OS |
| Hu, 202024 | China | ADT: DEB-TACE (Gemcitabine + Cisplatin) / cTACE (Gemcitabine + Cisplatin + lipiodol) | Apatinib | Apatinib | 13 | 10 | 55.9 | 58.7 | 7:6 | 2:8 | OS, PFS, ORR, AEs |
| Verma, 201825,& | America | EBRT | SYS | SYS | 666 | 2176 | 65 | 65 | 309:357 | 1095:1081 | OS |
| Chang, 201826,& | China | EBRT: CCRT / CTRT | Fluoropyrimidine* / Gemcitabine* | Fluoropyrimidine* / Gemcitabine* | 211 | 211 | 60.11 | 60.80 | 81:130 | 84:127 | OS |
| Konstantinidis, 201627 | America | ADT: HAI (Floxuridine*) | Gemcitabine* / Irinotecan* / 5-Fluoruracil* | Gemcitabine* / 5-Fluoruracil* | 78 | 26 | 62 | 26 | 47:31 | 13:13 | OS, ORR |
| Edeline, 201528,& | France | ADT: 90Y SIRT | Gemcitabine* / 5-Fluoruracil* | Gemcitabine + Cisplatin# | 24 | 33 | NR | NR | NR | NR | OS, PFS |
| Kim, 201329 | Korea | EBRT: CCRT | Capecitabine + Cisplatin | Capecitabine + Cisplatin | 25 | 67 | 56 | 58 | 6:19 | 14:53 | OS, PFS, ORR, AEs |
ADT = arterially directed therapy; AEs = adverse events; CCRT = concurrent chemoradiation therapy; cTACE = conventional transcatheter arterial chemoembolization; CTRT = sequential chemotherapy and radiotherapy; DEB-TACE = TACE with drug-eluting beads; 90Y SIRT = Yttrium-90 selective internal radiotherapy; EBRT = external beam radiation therapy; F = female; HAI = hepatic arterial infusion; ICIs = immune checkpoint inhibitors; LRT + ST = locoregional therapy combined with systemic therapy; M = male; MWA = microwave ablation; NR = not reported; ORR = objective response rate; OS = overall survival; PFS = progression-free survival; RFA = radiofrequency ablation; ST = systemic therapy; SYS = systemic chemotherapy; TACI = transarterial chemoinfusion; TACE = transarterial chemoembolization;
All studies included were retrospective cohort studies.
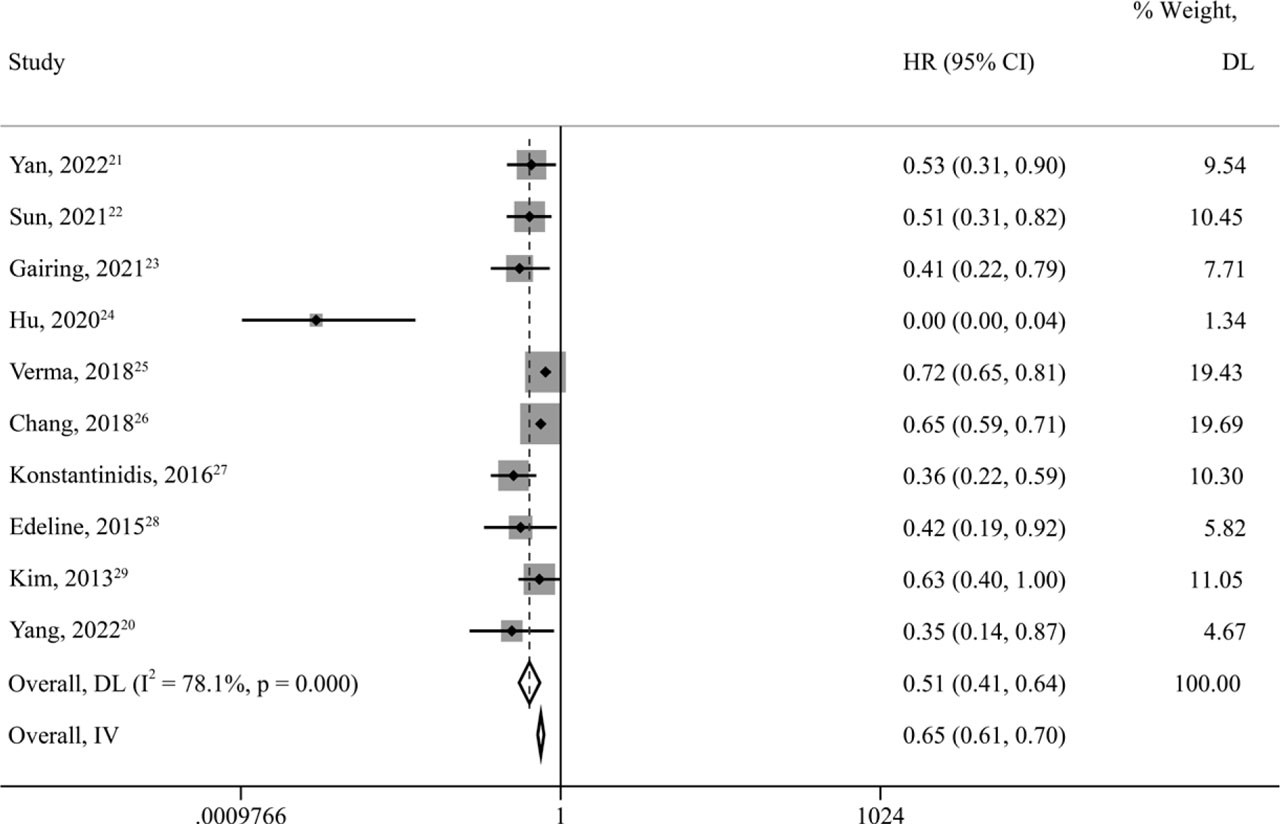
FIGURE 2.
Forest plots for overall survival (OS) in unresectable and metastatic intrahepatic cholangiocarcinoma (iCCA) patients treated by locoregional therapy combined with systemic therapy versus only systemic therapy.
95% CI = 95% confidence intervals; DL = DerSimonian–Laird method; HR = hazard ratio; IV = inverse variance method
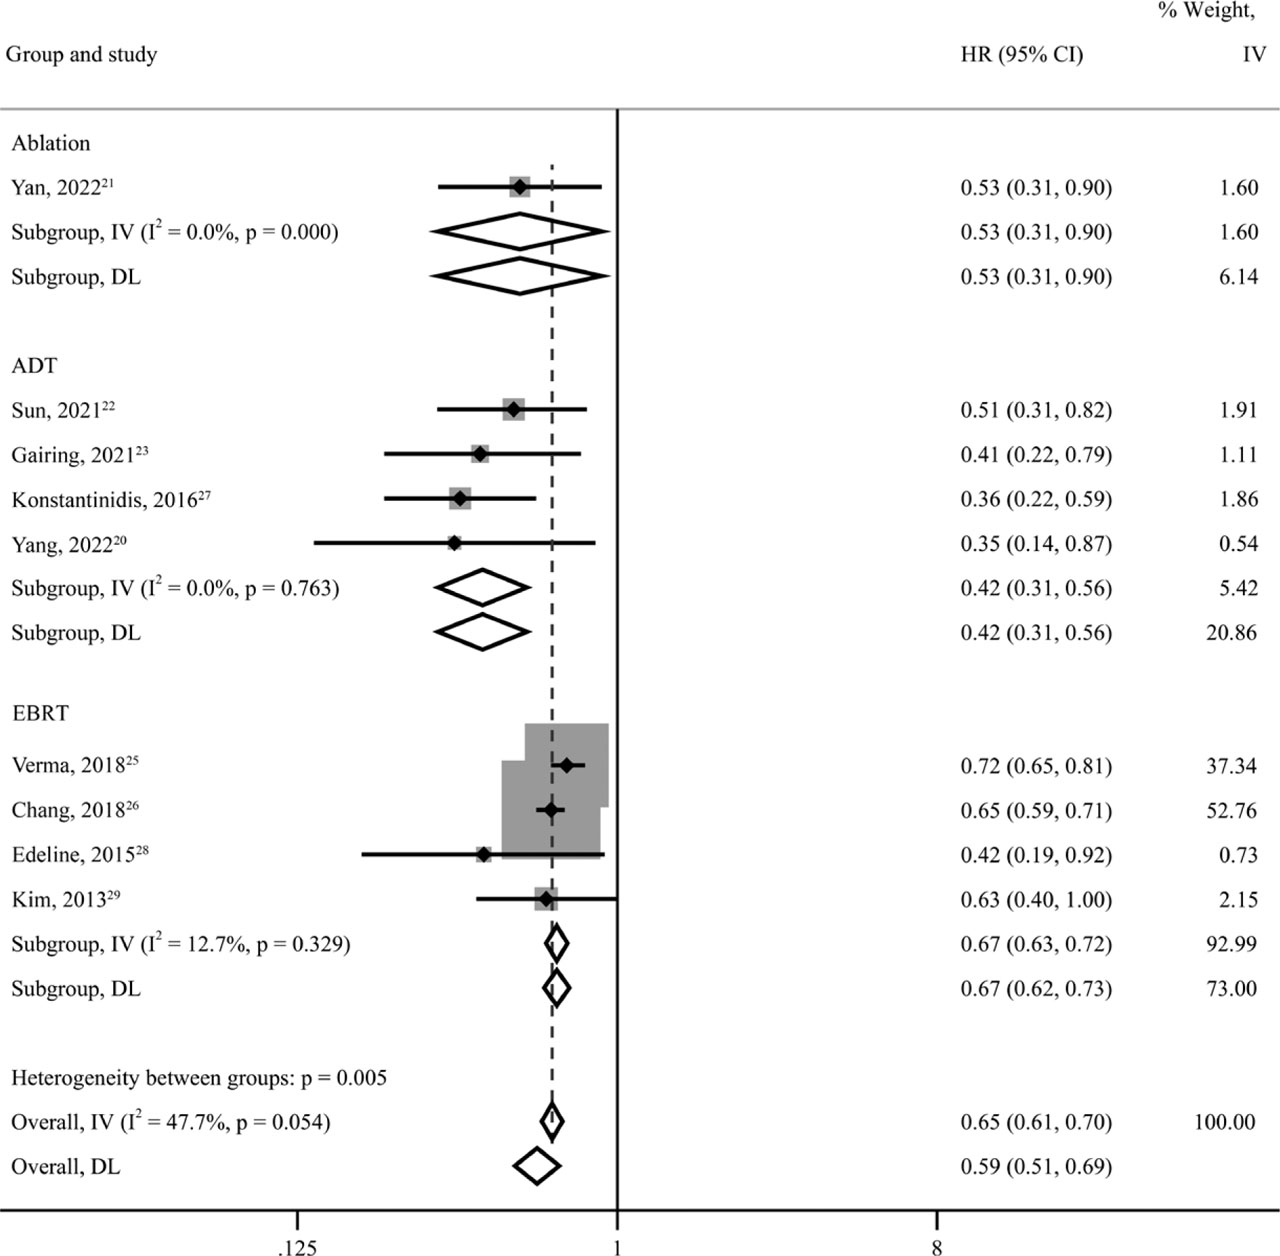
FIGURE 3.
Subgroup analysis of overall survival (OS) in unresectable and metastatic intrahepatic cholangiocarcinoma (iCCA) patients according to types of locoregional therapy combined with systemic therapy (ablation, ADT, RT). 95% CI = 95% confidence intervals.
ADT = arterially directed therapy; DL = DerSimonian–Laird method; HR = hazard ratio; IV = inverse variance method; EBRT= external beam radiation therapy
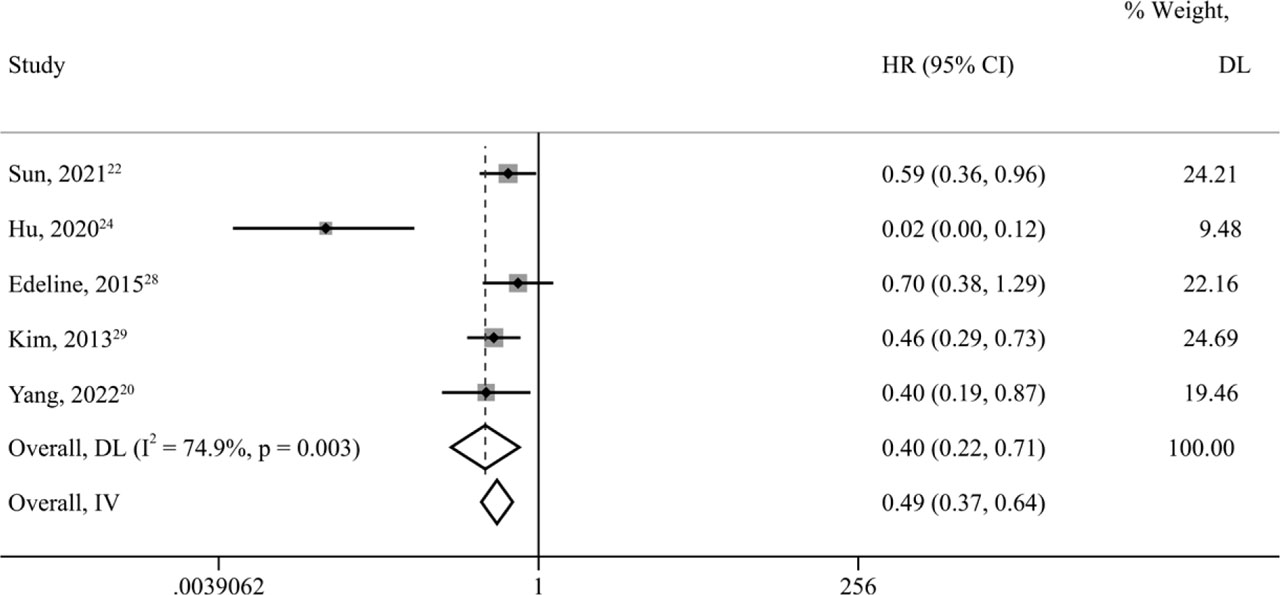
FIGURE 4.
Forest plots for progression-free survival (PFS) in unresectable and metastatic intrahepatic cholangiocarcinoma (iCCA) patients treated by locoregional therapy combined with systemic therapy versus only systemic therapy.
95% CI = 95% confidence intervals; DL = DerSimonian–Laird method; HR = hazard ratio; IV = inverse variance method
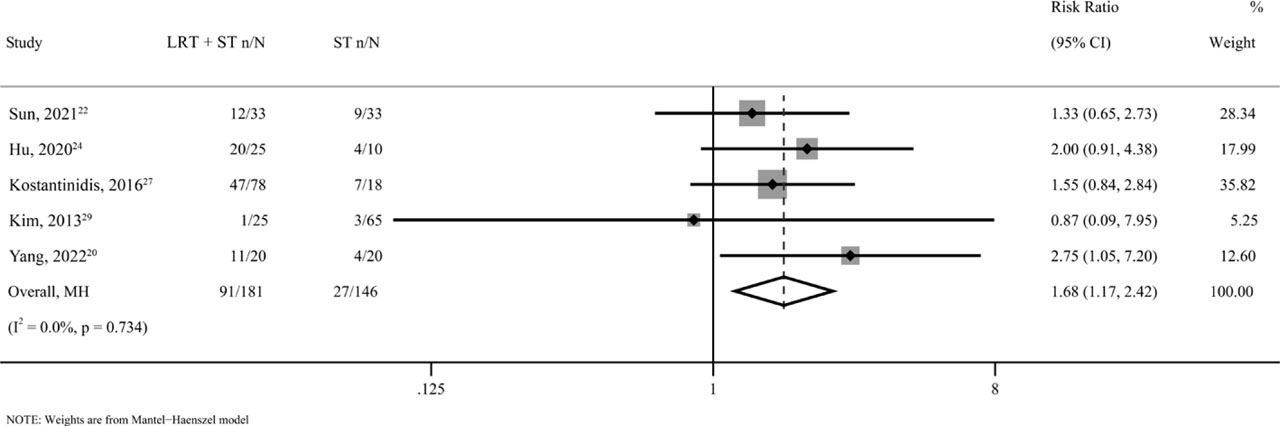
FIGURE 5.
Forest plots for objective response rate (ORR) in unresectable and metastatic intrahepatic cholangiocarcinoma (iCCA) patients treated by locoregional therapy combined with systemic therapy (LRT + ST) versus only systemic therapy (ST).
95% CI = 95% confidence intervals; MH = Mantel–Haenszel model; RR = relative risk.
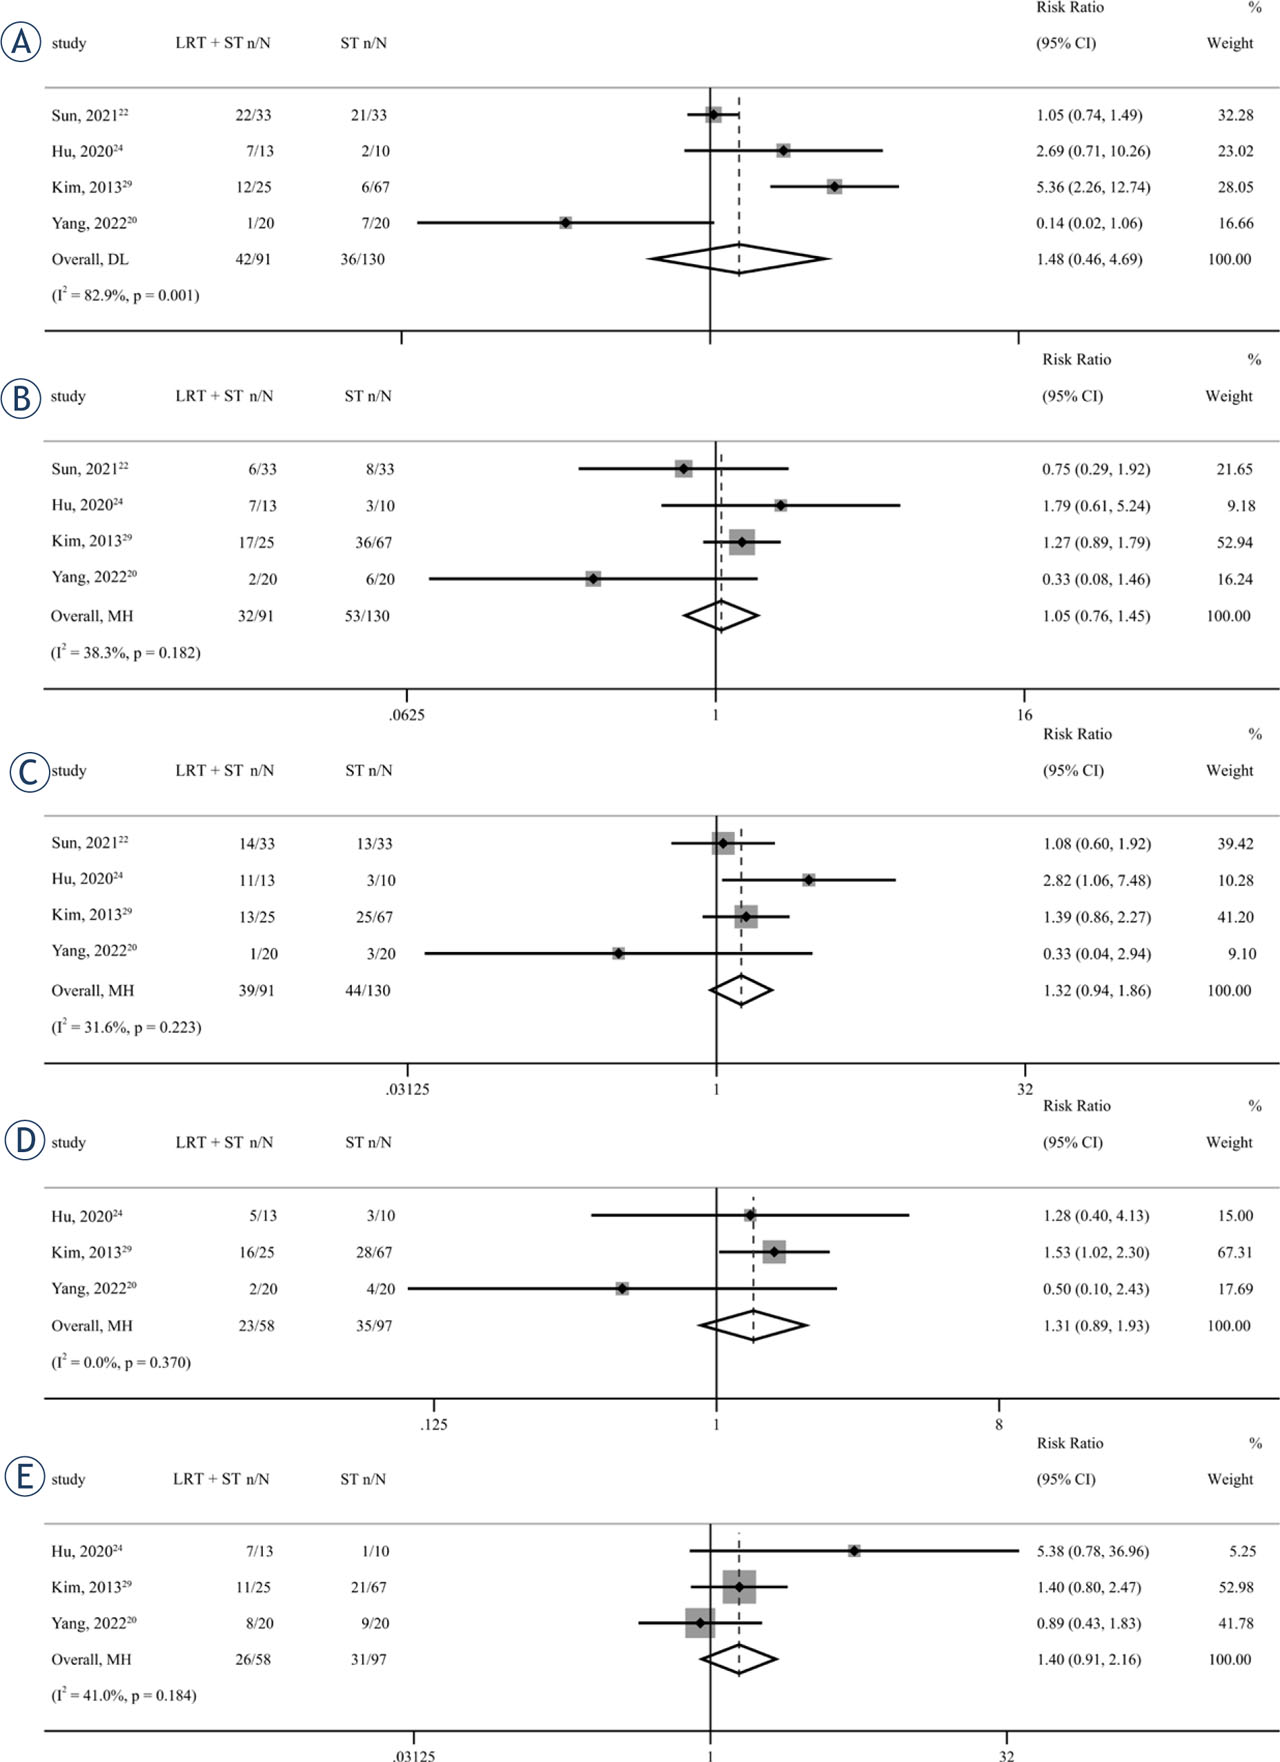
FIGURE 6.
Forest plots for the incidence of neutropenia (A), thrombocytopenia (B), anemia (C), anorexia (D), and vomiting (E) in unresectable and metastatic intrahepatic cholangiocarcinoma (iCCA) patients treated by locoregional therapy combined with systemic therapy (LRT + ST) versus only systemic therapy (ST).
95% CI = 95% confidence intervals; DL = DerSimonian–Laird method; MH = Mantel–Haenszel model; RR = relative risk.