
FIGURE 1.
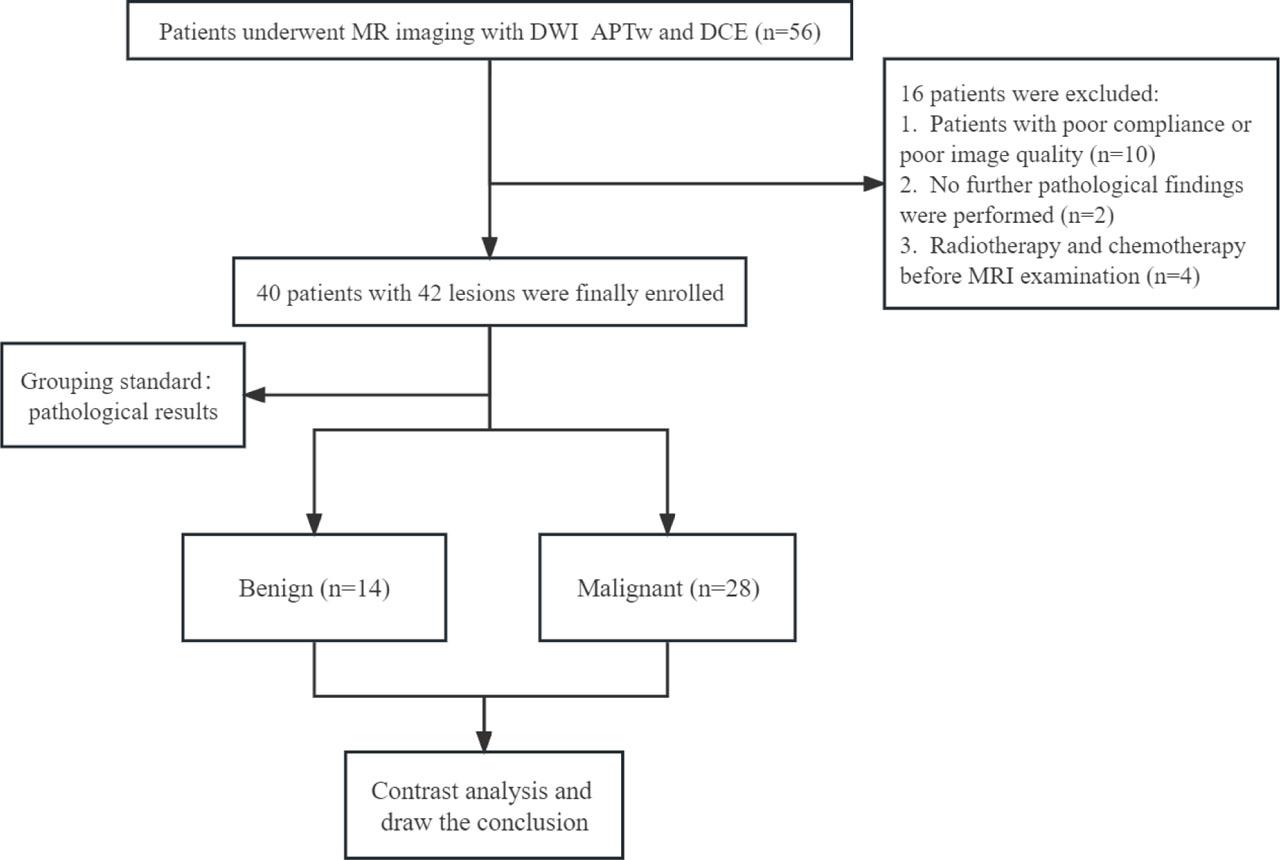
FIGURE 2.
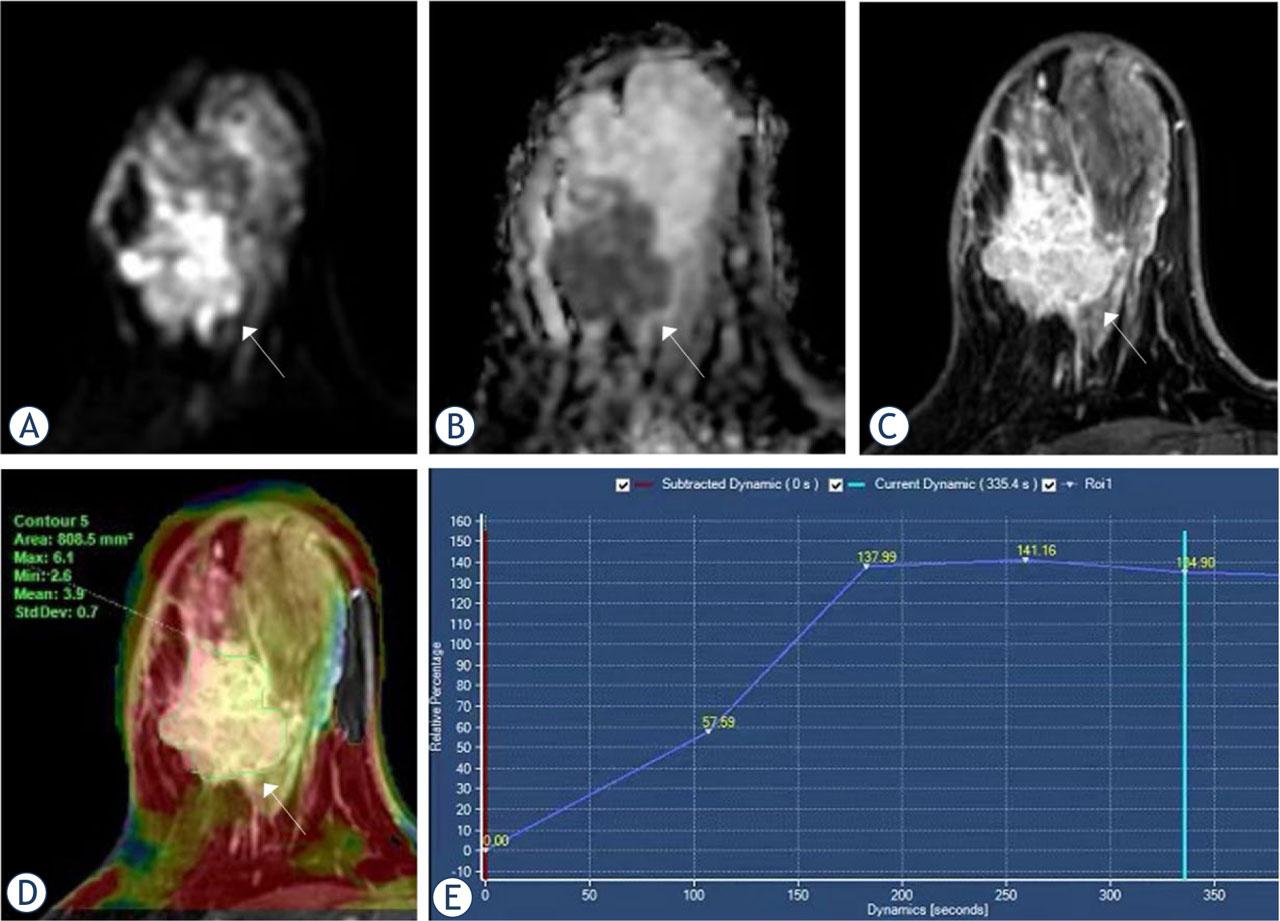
FIGURE 3.
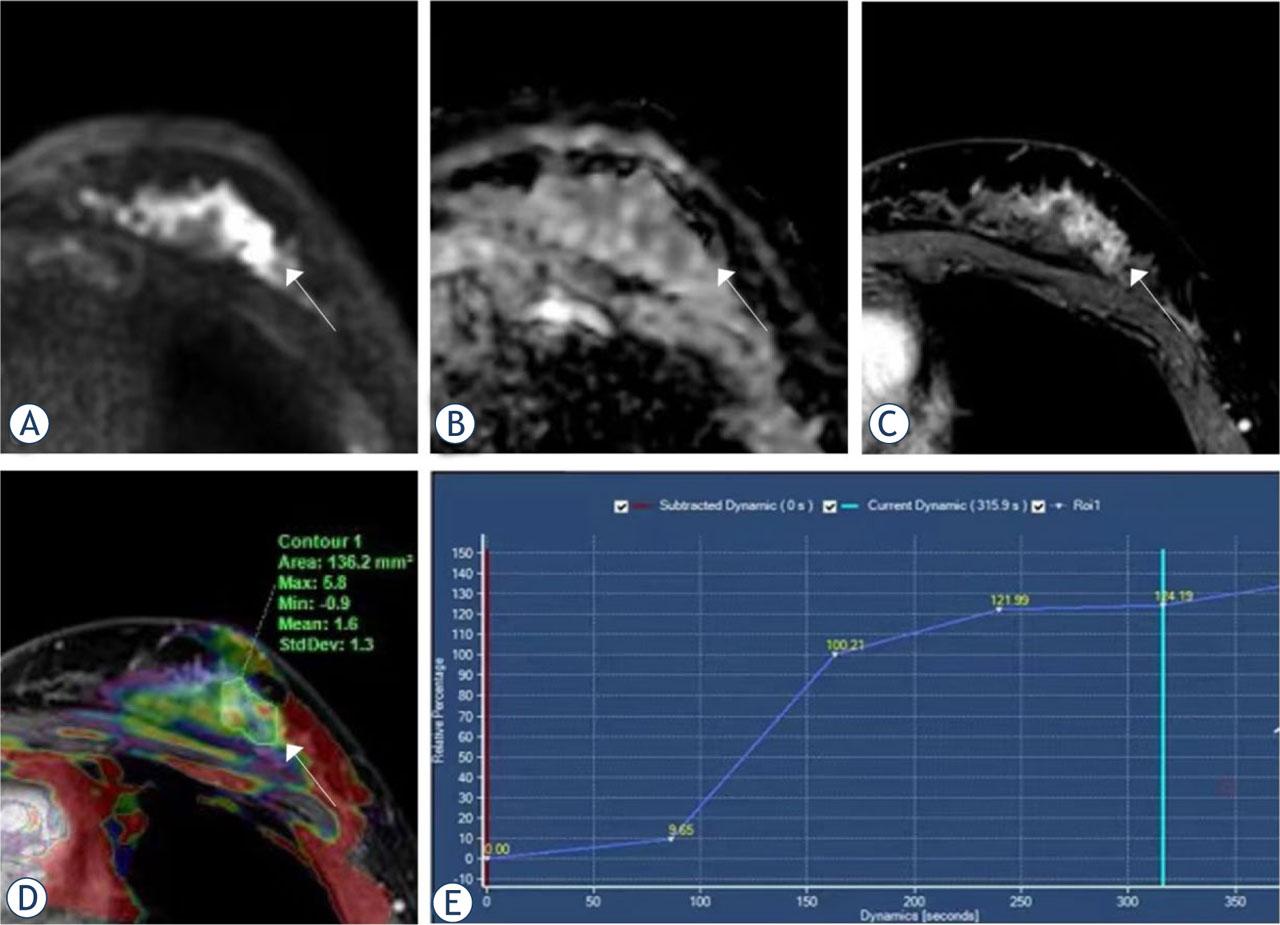
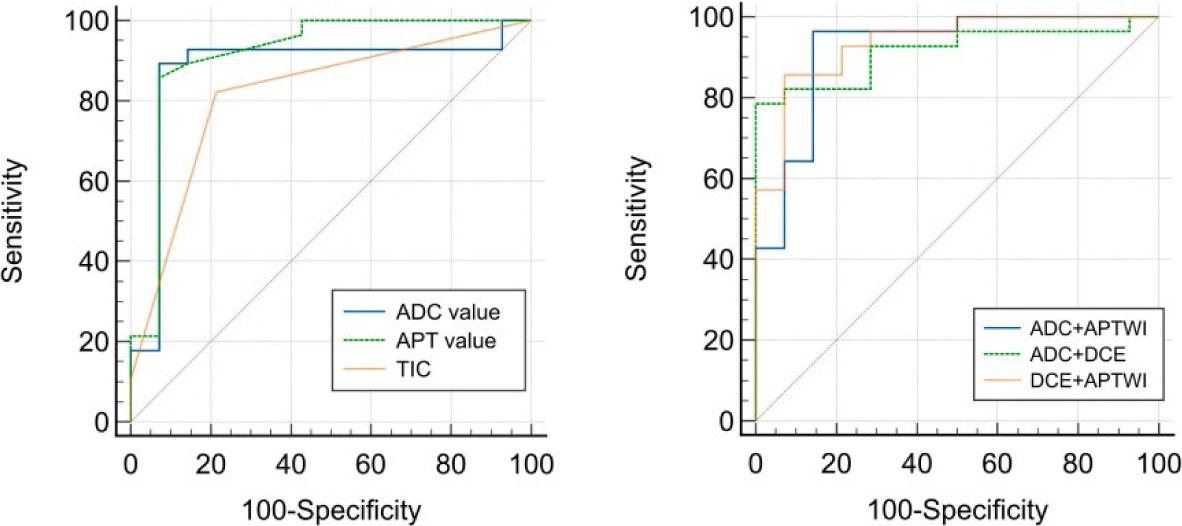
FIGURE 4.
Summary of patient characteristics
| Benign lesions (n = 14) | Malignant lesions (n = 28) | |
|---|---|---|
| Age (years) | 35 ± 14 (13–68) | 49 ± 12 (30–77) |
| Largest diameter (cm) | 2.19 ± 2.40 | 3.31 ± 1.25 |
| Histology | Fibroadenoma (n = 7) | Invasive breast carcinoma (n = 24) |
| Juvenile fibroadenoma (n = 1) | Ductal carcinoma in situ (n = 4) | |
| Adenosis (n = 2) | ||
| Fibroadenoma + adenosis (n = 2) | ||
| Intraductal papilloma (n = 1) | ||
| Benign phyllodes tumor (n = 1) |
Clinical and pathological data of breast cancer
| Variable | Malignant breast tumors (n = 28) |
|---|---|
| Tumor diameter | |
| < 2 cm | 3 (10.71) |
| ≥ 2 cm | 25 (89.29) |
| Metastatic status of axillary lymph node | 15 (53.57) |
| Calcification | 16 (57.14) |
| Grade of IBC (N, %) | |
| Grade I | 1 (4.17) |
| Grade II | 12 (50) |
| Grade III | 11 (45.83) |
| Receptor status (N, %) | |
| ER+ | 20 (71.43) |
| PR+ | 20 (71.43) |
| HER-2+ | 9 (32.14) |
| Ki67+ | 25 (89.29) |
ROC analysis of the performance in separating breast cancer from benign lesions using various criteria and techniques alone or in combination
| Multi parameters | Cutoff | Sensitivity | Specificity | AUC | 95%CI |
|---|---|---|---|---|---|
| Parameters | |||||
| APT value | > 2.35 | 85.71% | 92.86% | 0.915 | 0.786–0.978 |
| TIC | > 1 | 82.14% | 78.57% | 0.815 | 0.665–0.918 |
| ADC value | ≤ 1.26 | 89.29% | 92.86% | 0.878 | 0.739–0.958 |
| Methods | |||||
| ADC+APTWI | / | 85.71% | 96.43% | 0.921 | 0.795–0.982 |
| ADC+DCE | / | 71.43% | 89.29% | 0.916 | 0.788–0.979 |
| DCE+APTWI | / | 78.57% | 92.86% | 0.936 | 0.816–0.988 |
Imaging protocol parameters
| APTw | DWI | DCE | |
|---|---|---|---|
| TR [ms] | 5500 | 6356 | 4 |
| TE [ms] | 9 | 84 | 2 |
| Field of views [mm2] | 120 × 120 | 340 × 309 | 260 × 340 |
| Voxel size | 1.9 × 2.0 × 7 | 2.7 × 2.3 × 4 | 0.9 × 0.9 × 3.5 |
| Flip angle | 90 | 90 | 11 |
| Matrix (mm2) | 64 × 60 | 128 × 133 | 280× 368 |
| Reconstructed voxel size | 0.94 × 0.94 × 7 | 0.97 × 0.97 × 4 | 0.61 × 0.61 × 3.5 |
| b-value [s/mm2] | NA | 0,50,800 | NA |
| Bandwidth [pixel/Hz] | 406.9 | 23.1 | 783.2 |
| Scan duration | 5 min 03 s | 2 min 14 s | 7 min 44 s |
Comparison of different parameters between benign lesions and malignant lesions
| Measurement index | Benign lesions (n = 14) | Malignant lesions (n = 28) | P |
|---|---|---|---|
| APT value | 2.01 ± 0.51 | 3.18 ± 1.07 | < 0.001 |
| Type of TIC | < 0.001 | ||
| I | 11(78.6%) | 5(17.9%) | |
| II | 3(21.4%) | 20(71.4%) | |
| III | 0 | 3(10.7%) | |
| ADC value | 1.64 ± 0.41 | 1.13 ± 0.36 | < 0.001 |