
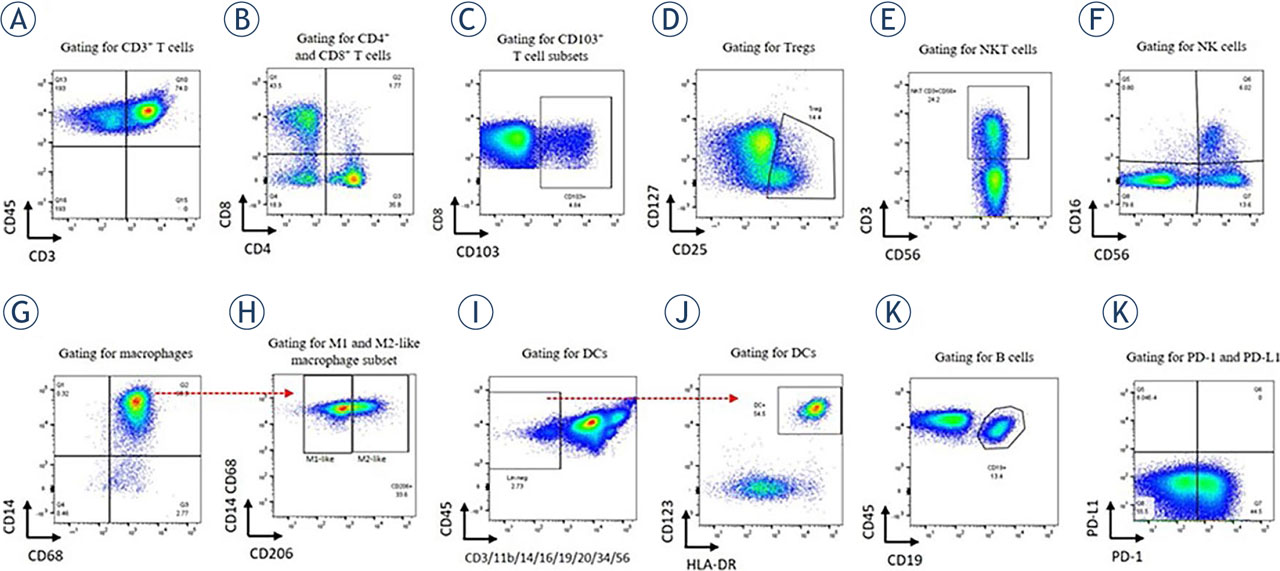
FIGURE 1.
Gating strategy for immune cells in ascites. (A) CD3+ T cells were gated on CD45+. (B) The depicted gate shows CD4+ vs. CD8+ subsets gated on CD3+ T cells and (C) CD103 expression on CD8+. The same gating strategy was applied for CD103 expression on CD4+ (not shown). (D) Gating representative for Tregs. The dot plot depicts CD4+ cells discriminated according to CD127 and CD25 positivity. (E) NKT cells were gated according to CD3 and CD56 positivity. (F) NK cells were gated according to CD16 and CD56 positivity. Two subsets were defined: CD56brightCD16− and CD56dimCD16+. (G) The dot plot depicts macrophages according to CD14 and CD68 positivity (pre-gated on CD11b+CD45+ cells). (H) M1-like macrophages were defined as CD206− macrophages, and M2-like as CD206+ macrophages. (I) DCs were gated per exclusion − as lineage-negative cells (no expression of CD3/CD11b/CD14/CD16/CD19/CD20/CD34/CD56) and further discriminated by CD123 and HLA-DR positivity. (J) B cells were gated as CD19+ cells per CD45+. (K) PD-1 and PD-L1 positivity was detected on each cell population/subset.
TABLE 1.
Clinical characteristics of the patients included in the study
| Age at diagnosis (years) | |
| Mean | 64 |
| Range | 41–84 |
| FIGO stage (N, %) | |
| IIIB | 1 (2) |
| IIIC | 34 (72) |
| IVA | 7 (15) |
| IVB | 5 (11) |
| Surgery (N, %) | |
| Primary | 11 (23) |
| Interval | 23 (49) |
| No surgery (remained inoperable) | 13 (28) |
| Residual disease after surgery (N, %) | |
| No residual tumor | 19 (40) |
| Residual tumor ≤ 1 cm | 12 (26) |
| Residual tumor > 1 cm | 3 (6) |
| Chemotherapy (N, %) | |
| Adjuvant | 11 (23) |
| Neoadjuvant* | 36 (77) |
| Bevacizumab (N, %) | |
| No | 31 (66) |
| Yes | 16 (34) |
| Positive family history (N, %) | |
| No | 30 (64) |
| Yes | 17 (36) |
| BRCA1/2 mutation (N, %) | |
| No | 31 (66) |
| Yes | 12 (26) |
| Unknown | 4 (9) |
| Olaparib (N, %) | |
| No | 35 (74) |
| Yes | 12 (26) |
| Disease progression | |
| No | 11 (23) |
| Yes | 36 (47) |
| Death | |
| No | 24 (51) |
| Yes | 23 (49) |
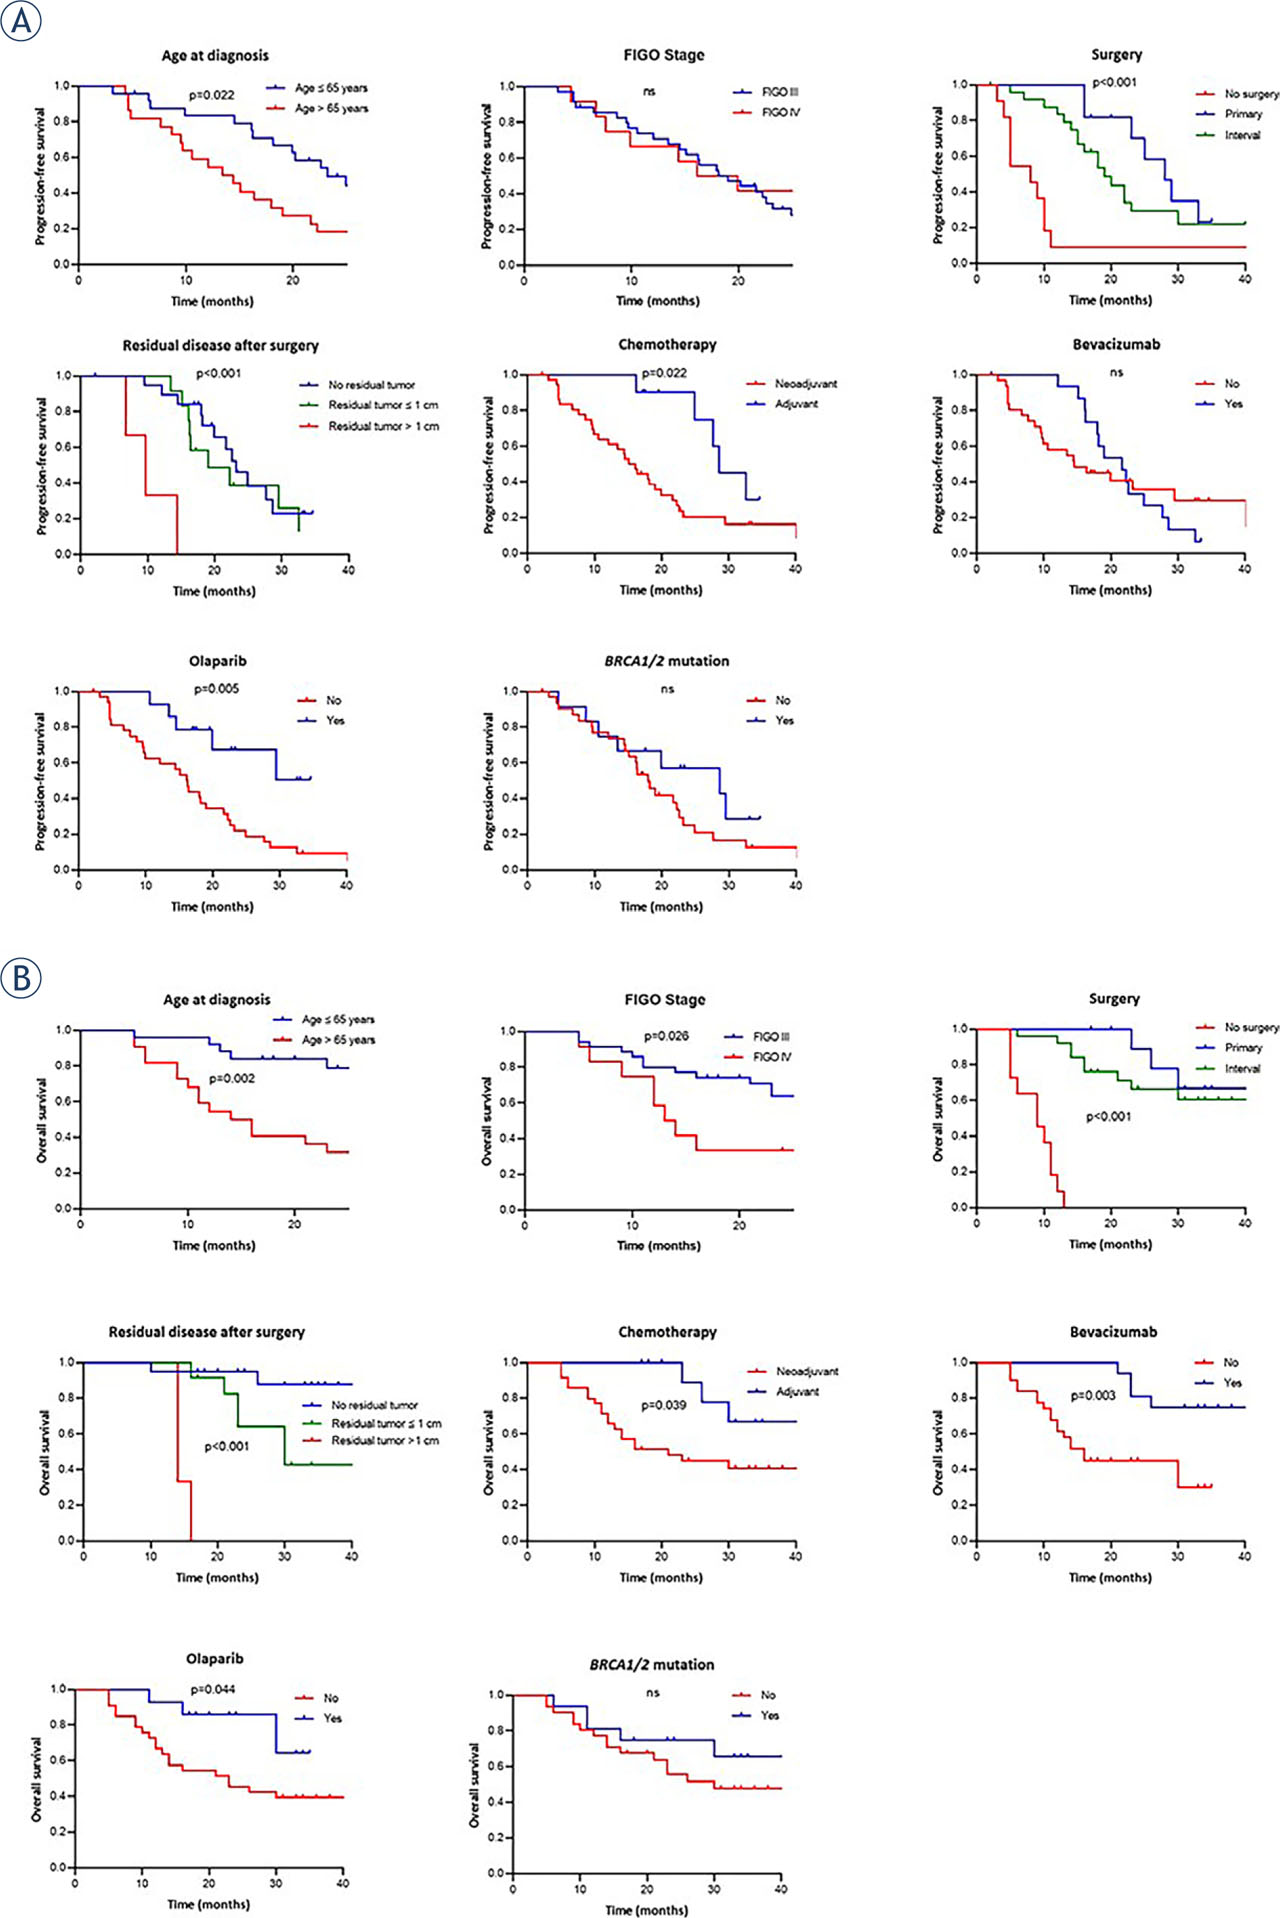
FIGURE 2.
Kaplan-Meier curves for (A) progression-free survival (PFS) and (B) overall survival (OS) of high-grade serous carcinoma (HGSC) patients based on treatment characteristics.
ns = non-significant
TABLE 2.
Univariate analysis of patient's survival based on treatment characteristics
| Progression-free survival | Overall survival | |||||
|---|---|---|---|---|---|---|
| HR (95% Cl) | P-value | HR (95% Cl) | P-value | |||
| Age at diagnosis (≤ 65 vs. > 65 years) | 0.504 | 0.266–0.954 | 0.022 | 0.271 | 0.117–0.627 | 0.002 |
| FIGO stage (III vs. IV) | 1.331 | 0.691–2.566 | 0.381 | 0.312 | 0.112–0.872 | 0.026 |
| Surgery | < 0.001 | < 0.001 | ||||
| no vs. primary | 3.365 | 1.248–9.072 | 0.002 | 9.907 | 3.045–32.23 | < 0.001 |
| no vs. interval | 2.981 | 1.133–7.845 | 0.001 | 8.529 | 2.270–32.05 | < 0.001 |
| primary vs. interval | 0.570 | 0.253–1.282 | 0.192 | 0.605 | 0.186–1.973 | 0.239 |
| Residual disease after surgery | < 0.0001 | < 0.001 | ||||
| no residual tumor vs. ≤ 1cm | 0.764 | 0.314–1.858 | 0.538 | 0.189 | 0.045 –0.799 | 0.020 |
| no residual tumor vs. > 1cm | 0.121 | 0.006–2.256 | < 0.001 | 0.066 | 0.003–1.408 | < 0.001 |
| residual tumor ≤ 1cm vs. > 1cm | 0.131 | 0.008–2.209 | < 0.001 | 0.131 | 0.009–1.988 | < 0.001 |
| Chemotherapy (adjuvant vs. neoadjuvant) | 0.358 | 0.177–0.725 | 0.022 | 0.307 | 0.129–0.732 | 0.039 |
| Bevacizumab (no/yes) | 0.979 | 0.500–1.917 | 0.950 | 4.280 | 1.888–9.703 | 0.003 |
| BRCA1/2 mutation (no vs. yes) | 1.721 | 0.827–3.584 | 0.186 | 1.734 | 0.698–4.307 | 0.274 |
| Olaparib (no vs. yes) | 3.486 | 1.765–6.884 | 0.005 | 3.148 | 1.329–7.629 | 0.044 |
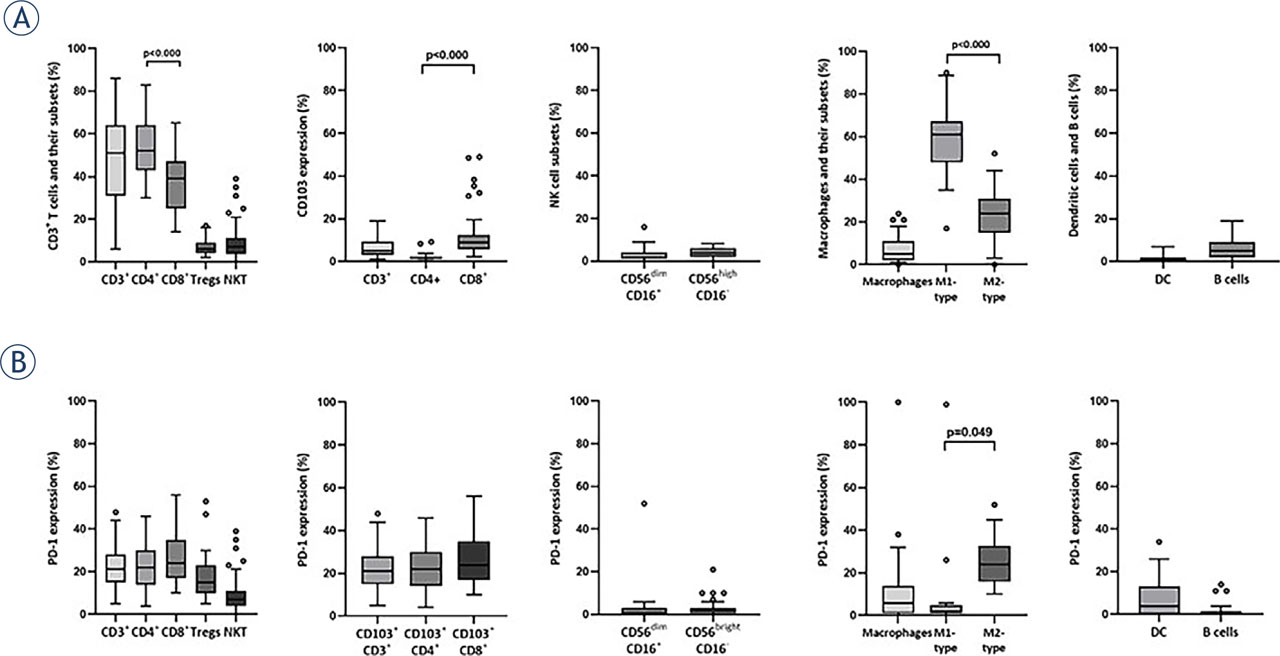
FIGURE 3.
Box plots showing median (range) and quartiles for (A) T cells, NK cells, macrophages, DCs, B cells, and their subsets in the ascites of HGSC patients, and (B) the expression of PD-1 for each immune population/subset at disease presentation. CD3+ T cells, NKT cells, CD56brightCD16− and CD56dimCD16+ NK cells, macrophages, DCs, and B cells are given as a percentage per all CD45+ cells, while each subset is given as a percentage per its main population.
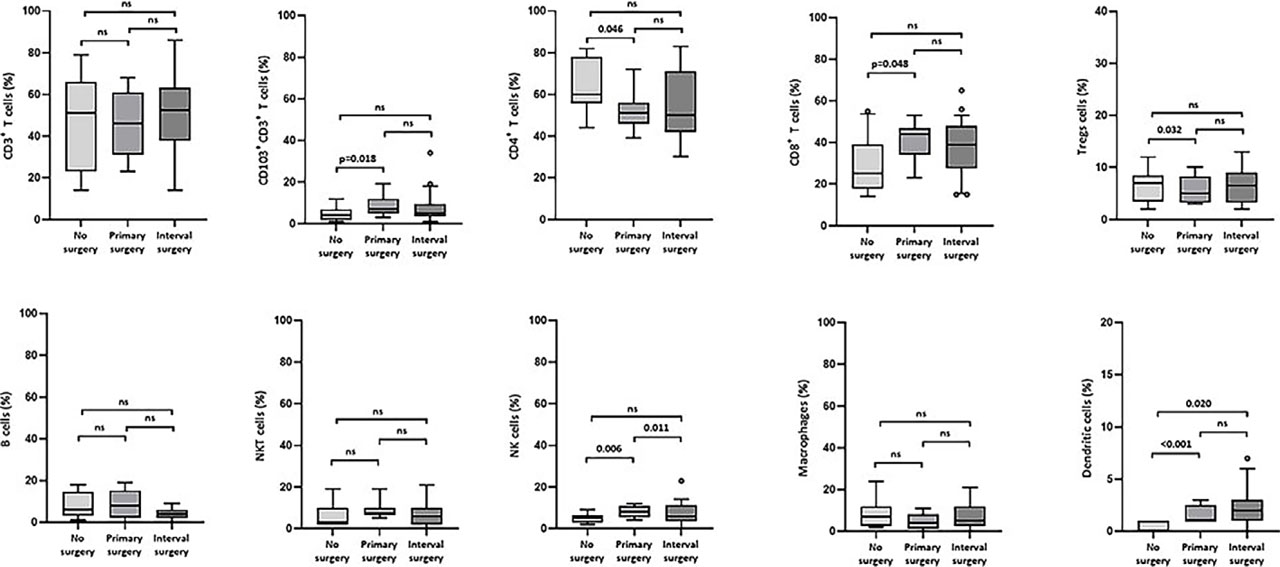
FIGURE 4.
Box plots showing the median (range) and quartiles for the percentages of different immune cells at presentation and their association with surgery type (no surgery vs. primary vs. interval) the patients were later assigned with.
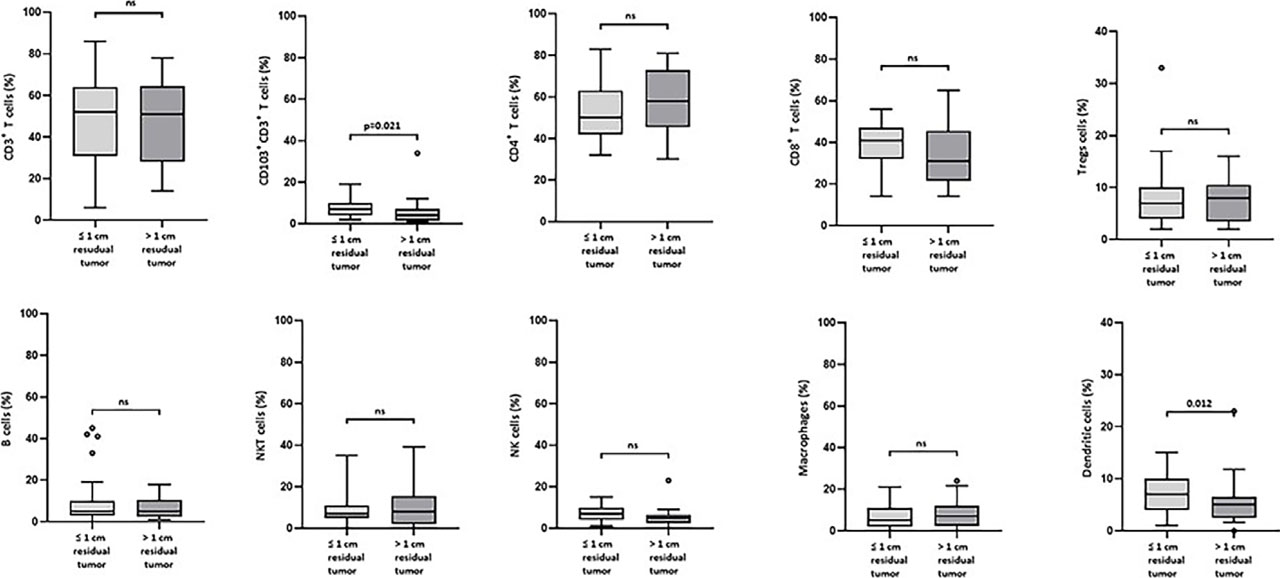
FIGURE 5.
Box plots showing the median (range) and quartiles for the percentages of different immune cells at presentation and their association with residual disease after surgery (less (no and ≤ 1cm) residual tumor vs. more (< 1 cm and inoperable) residual tumor).
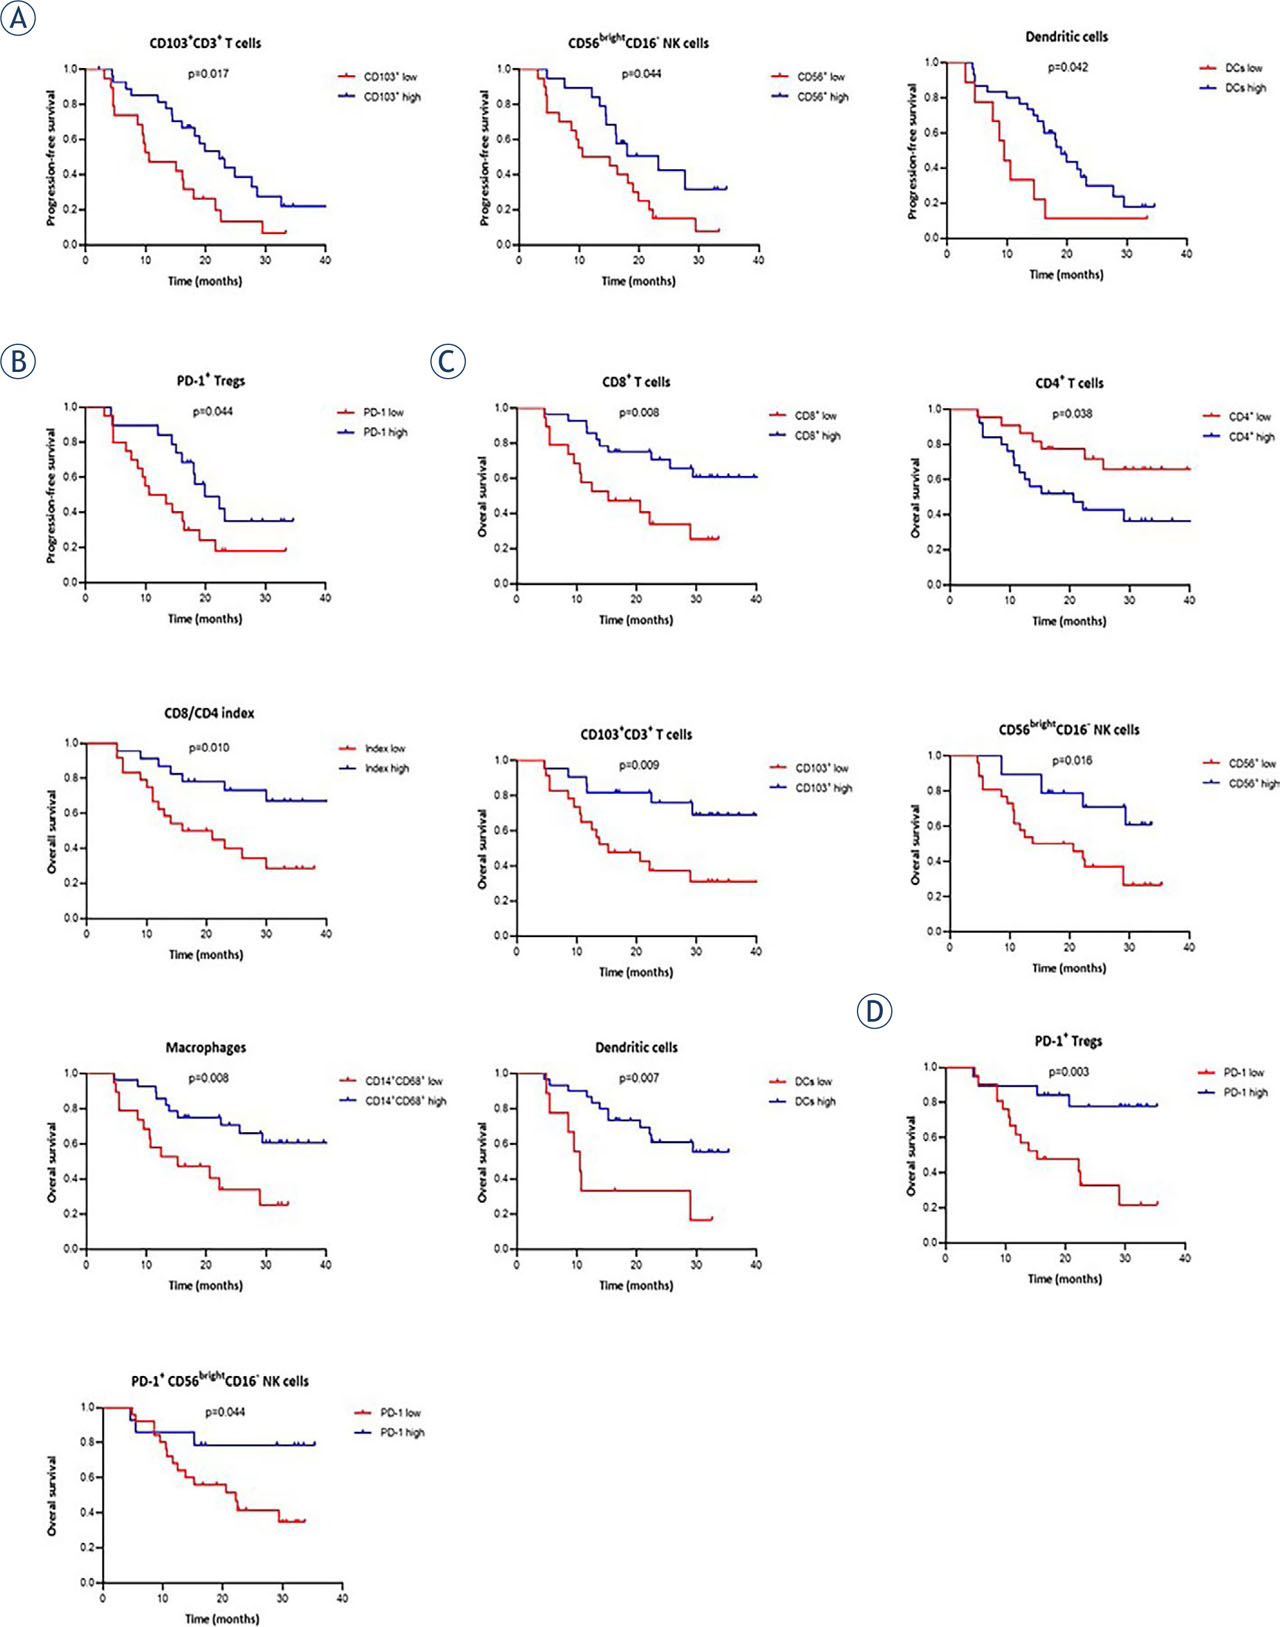
FIGURE 6.
Kaplan-Meier curves for progression-free survival (PFS) and overall survival (OS) of high-grade serous carcinoma (HGSC) patients. PFS curves show significant differences for patients stratified as having (A) low or high percentages of immune cells, (B) low or high expression of PD-1 on immune cells, OS curves show significant differences for patients stratified as having (C) low or high percentages of immune cells, (D) low or high expression of PD-1 on immune cells. Cut-off values were based on the population median. P-values for significant differences are given.
TABLE 3.
Univariate analysis of patient's survival based on the low/high percentages of immune cells in the ascites at disease presentation
| Progression-free survival | Overall survival | |||||
|---|---|---|---|---|---|---|
| HR (95% Cl) | P-value | HR (95% Cl) | P-value | |||
| CD3+ (low vs. high) | 1.098 | 0.563–2.142 | 0.777 | 0.670 | 0.301–1.493 | 0.324 |
| CD4+ (low vs. high) | 0.547 | 0.260–1.150 | 0.110 | 0.401 | 0.174–0.928 | 0.038 |
| CD8+ (low vs. high) | 1.918 | 0.887–4.148 | 0.066 | 2.854 | 1.182–6.889 | 0.008 |
| CD8/CD4 index (low vs. high) | 1.076 | 0.560–2.069 | 0.820 | 2.973 | 1.304–6.780 | 0.010 |
| Tregs (low vs. high) | 0.856 | 0.412–1.778 | 0.677 | 0.807 | 0.324–2.006 | 0.649 |
| CD103+CD3+ (low vs. high) | 2.152 | 1.050–4.408 | 0.017 | 3.234 | 1.365–7.661 | 0.009 |
| CD103+CD4+ (low vs. high) | 0.515 | 0.232–1.147 | 0.108 | 0.816 | 0.328–2.031 | 0.661 |
| CD103+CD8+ (low vs. high) | 1.984 | 0.899–4.379 | 0.085 | 1.744 | 0.706–4.309 | 0.245 |
| NKT cells (low vs. high) | 0.520 | 0.246–1.101 | 0.060 | 1.208 | 0.507–2.878 | 0.661 |
| CD56brightCD16− NK cells (low vs. high) | 2.111 | 1.013–4.396 | 0.044 | 2.903 | 1.304–6.464 | 0.016 |
| CD56dim16+ NK cells (low vs. high) | 1.399 | 0.694–2.820 | 0.362 | 1.851 | 0.756–4.533 | 0.157 |
| Macrophages (low vs. high) | 0.601 | 0.245–1.478 | 0.275 | 1.943 | 0.754–5.006 | 0.008 |
| M1-like macrophages (low vs. high) | 0.868 | 0.224–3.370 | 0.835 | 1.562 | 0.321–7.604 | 0.533 |
| M2-like macrophages (low vs. high) | 2.142 | 0.553–8.297 | 0.224 | 2.854 | 1.182–6.889 | 0.080 |
| B cells (low vs. high) | 1.161 | 0.560–2.450 | 0.686 | 0.464 | 0.188–1.141 | 0.102 |
| DCs (low vs. high) | 2.245 | 0.799–6.310 | 0.042 | 3.307 | 0.939–11.65 | 0.007 |
TABLE 4.
Multivariate analysis of the treatment characteristics and immune cells
| Variables included in the multivariate analysis | Progression-free survival | Overall survival | ||||
|---|---|---|---|---|---|---|
| HR (95% Cl) | P-value | HR (95% Cl) | P-value | |||
| Primary surgery (no vs. yes) | 0.640 | 0.194–2.114 | 0.509 | 0.592 | 0.101–3.454 | 0.560 |
| Residual disease after surgery (no residual tumor and ≤ 1 cm of residual tumor vs. > 1 cm residual tumor) | 0.408 | 0.169–0.983 | 0.046 | 0.009 | 0.001–0.092 | < 0.001 |
| CD103+CD3+ (low vs. high) | 0.605 | 0.266–1.374 | 0.230 | 0.632 | 0.182–1.307 | 0.470 |
| CD56brightCD16− NK cells (low vs. high) | 1.707 | 0.683–4.265 | 0.252 | NA | NA | NA |
| DCs (no vs. yes) | 0.394 | 0.155–0.998 | 0.049 | 0.419 | 0.135–1.307 | 0.134 |
| Macrophages (low vs. high) | NA | NA | NA | 0.592 | 0.101–3.545 | 0.560 |
[i] NA = no available