
FIGURE 1.
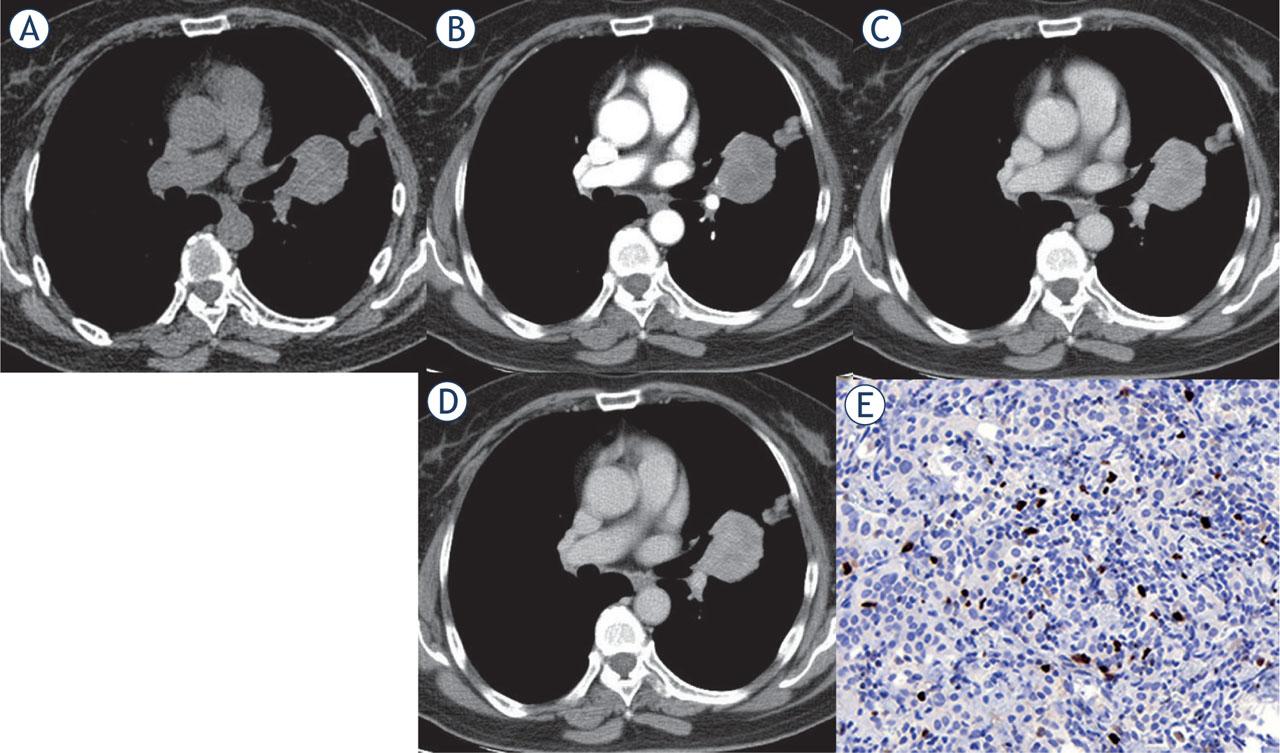
FIGURE 2.
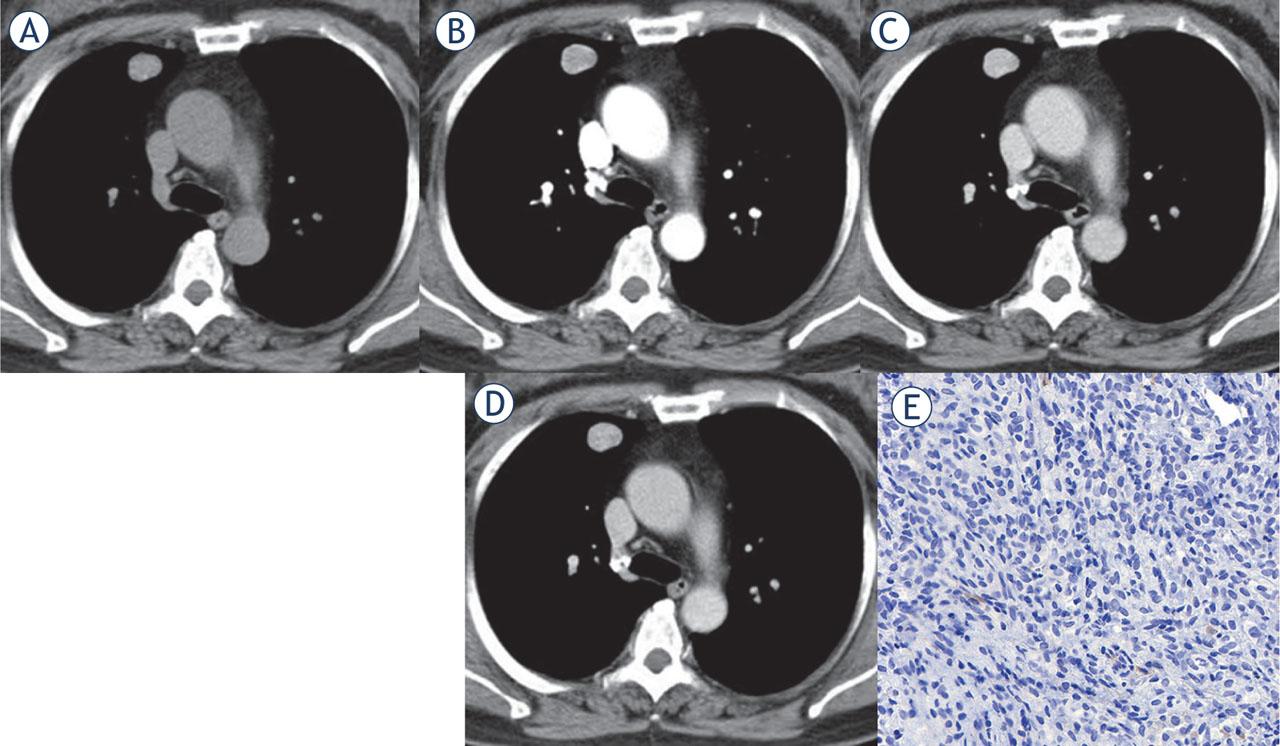
Imaging and clinical comparisons between central and peripheral pulmonary sclerosing pneumocytomas (PSPs)
| Central PSPs (n = 15) | Peripheral PSPs (n = 18) | P | |
|---|---|---|---|
| Age (years) | 56.6 ± 8.5 | 51.6 ± 7.7 | 0.244 |
| Size (cm3) | 10.39 ± 3.25 | 4.65 ± 2.61 | 0.013* |
| Respiratory symptoms | |||
| n, present:absent | 11:4 | 4:14 | 0.037* |
| Unenhanced CT density (Hu) | 37.57 ± 15.61 | 43.64 ± 13.09 | 0.312 |
| Arterial phase CT density (Hu) | 67.09 ± 16.99 | 69.79 ± 18.67 | 0.767 |
| Venous phase CT density (Hu) | 91.36 ± 20.43 | 97.14 ± 21.38 | 0.373 |
| Delayed phase CT density (Hu) | 98.73 ± 26.53 | 74.71 ± 24.97 | 0.044* |
| Net enhancement value (Hu) | 61.47 ± 12.18 | 57.11 ± 10.28 | 0.205 |
| Peak enhancement value (Hu) | 98.73 ± 26.53 | 97.14 ± 21.38 | 0.828 |
| Enhancement washout value (Hu) | 3.8 ± 8.14 | 20.78 ± 10.22 | < 0.001* |
| TTP (s) | 100.81 ± 19.01 | 62.67 ± 20.96 | < 0.001* |
| Accelerated index | 0.63 ± 0.17 | 0.99 ± 0.25 | < 0.001* |
| Ki-67 index | |||
| n, low:high# | 9:6 | 17:1 | 0.030* |
| Overlying vessel sign | |||
| n, present:absent | 13:2 | 8:10 | 0.027* |
| Prominent pulmonary artery sign | |||
| n, present:absent | 11:4 | 5:13 | 0.015* |
| Obstructive inflammation/atelectasis | |||
| n, present:absent | 4:11 | 0:18 | 0.033* |
| Halo sign | |||
| n, present:absent | 1:14 | 7:11 | 0.046* |
| Peak phase | |||
| n, venous phase:delayed phase | 3:12 | 15:3 | < 0.001* |