
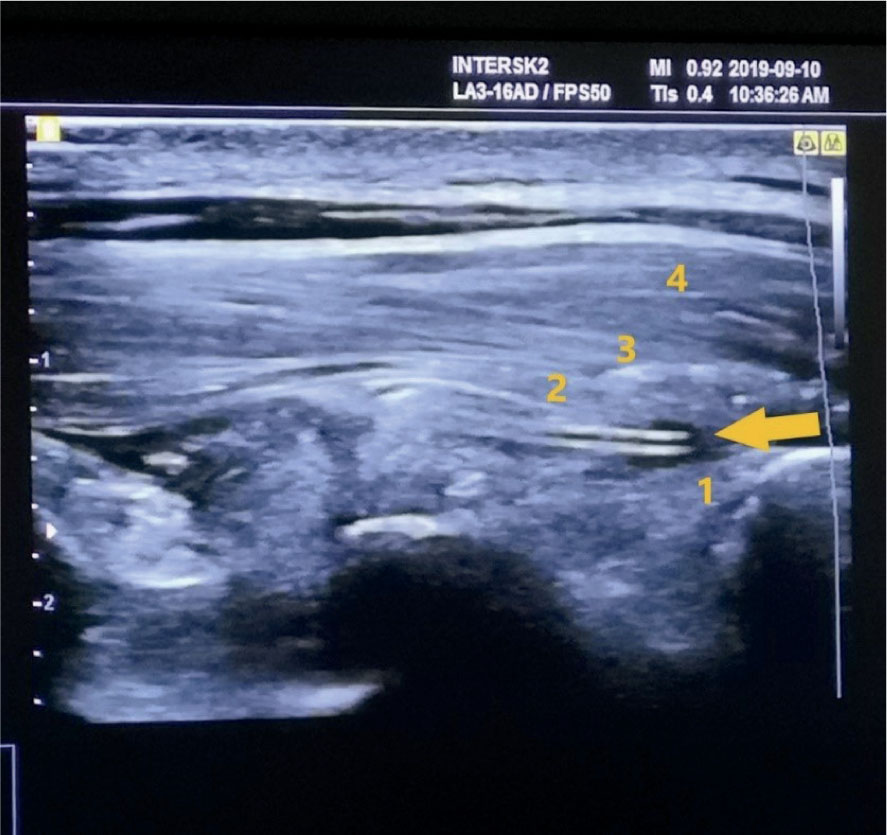
FIGURE 1.
Ultrasound image of the inserted ESPB catheter (marked by an arrow) and interfascial hydro-dissection.
1 – underlying thoracic lamina, 2 – m. erector spinae, 3 – m. rhomboideus, 4 – m. trapezius
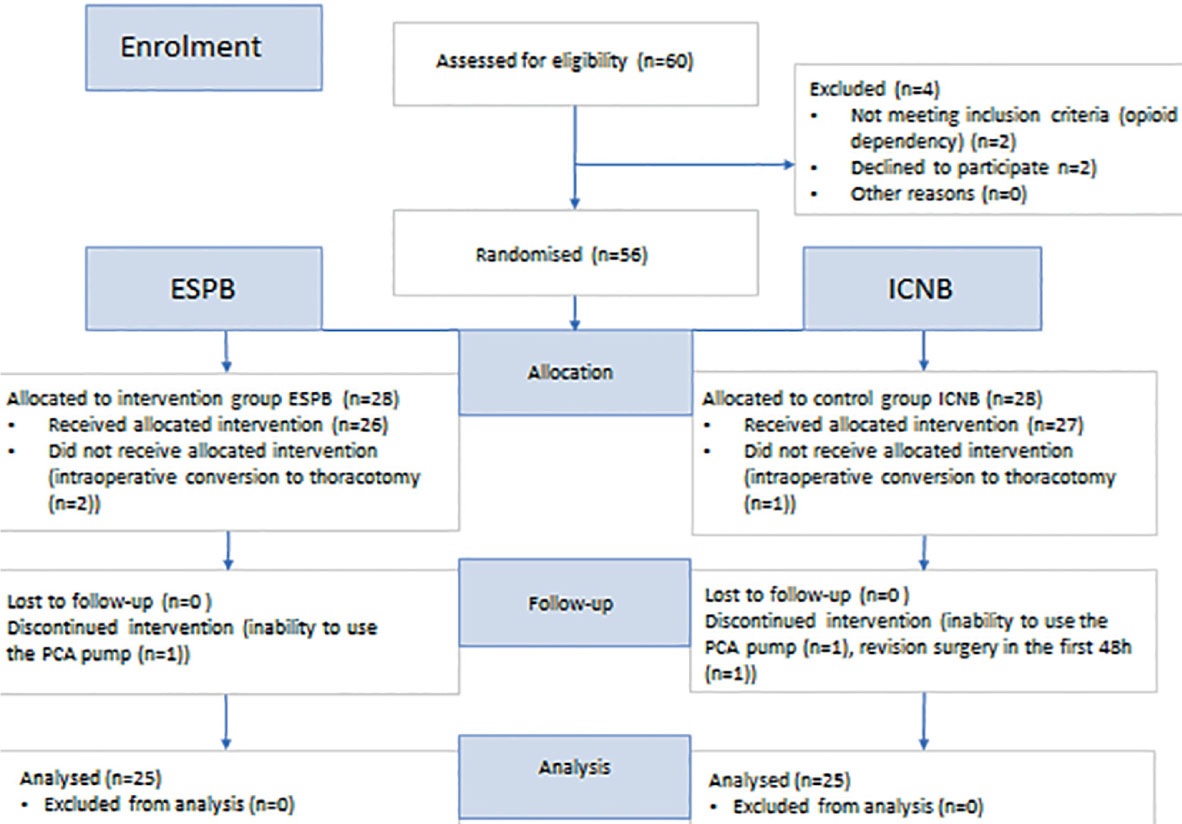
FIGURE 2.
CONSORT flow diagram.
ESPB = erector spinae plane block; ICNB = intercostal nerve block; PCA pump = patient-controlled analgesia pump
TABLE 1.
Demographic data
| Total | ESPB | ICNB | p-value | |
|---|---|---|---|---|
| Patients enrolled | 50 | 25 | 25 | |
| Gender (male/female) | 30/20 | 17/8 | 13/12 | 0.25 |
| Age (years)* | 69.80 ± 8.41 | 69.44 ± 8.20 | 70.2 ± 8.76 | 0.53 |
| Height (cm)* | 170.20 ± 8.49 | 172.04 ± 8.01 | 168.36 ± 8.72 | 0.15 |
| Weight (kg)* | 76.62 ± 14.07 | 76.24 ± 14.36 | 77.00 ± 14.03 | 0.72 |
| BMI (kg/m2)* | 26.37 ± 3.93 | 25.72 ± 4.18 | 27.03 ± 3.64 | 0.21 |
| ASA 1/2/3 | 1/25/24 | 0/14/11 | 1/11/13 | 0.47 |
| FEV1 before the surgery | 94.78 ± 21.57 | 95.45 ± 21.84 | 94.17 ±21.77 | 0.88 |
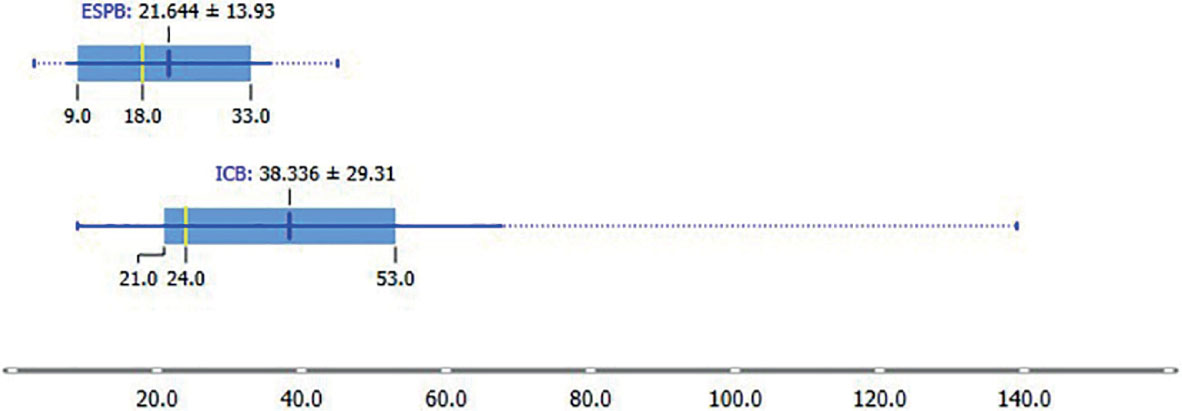
FIGURE 3.
Cumulative piritramide use in the first 48 hours after surgery. The values in the graph are marked as mean (blue), median (yellow), and interquartile range.
ESPB = erector spinae plane block; ICNB = intercostal nerve block
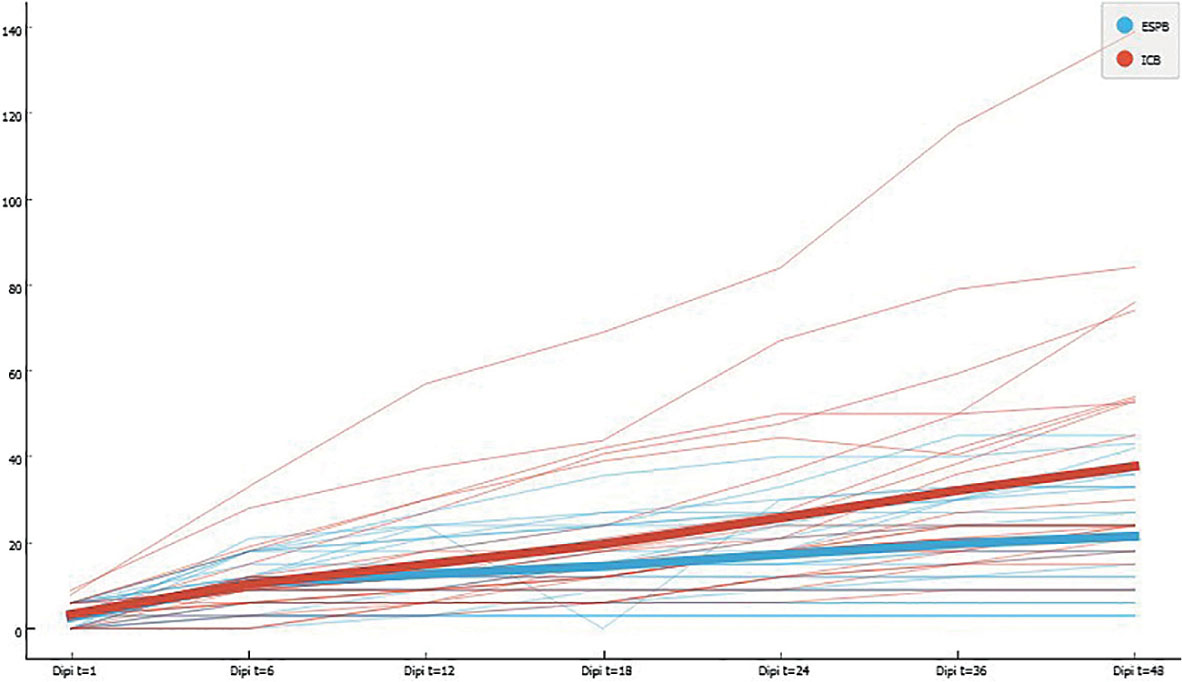
FIGURE 4.
Cumulative opioid consumption in the first 48 h after surgery. The bold line shows the median values for each group.
TABLE 2.
Maximal inspiratory and expiratory muscle strength
| Respiratory test values (%) | ESPB | ICNB | p-value | |
|---|---|---|---|---|
| MIP | 24 hours | 71.58 ± 16.69 | 75.98 ± 24.04 | 0.088 |
| 48 hours | 73.42 ± 19.10 | 88.11 ±30.72 | 0.110 | |
| MEP | 24 hours | 73.36 ± 20.82 | 85.55 ± 37.35 | 0.182 |
| 48 hours | 74.90 ± 22.39 | 98.90 ± 32.29 | 0.645 | |
[i] Respiratory test values are expressed as percentages from the baseline value.
[ii] ESPB = erector spinae plane block; ICNB = intercostal nerve block; MEP = maximal expiratory pressure; MIP = maximal inspiratory pressure