
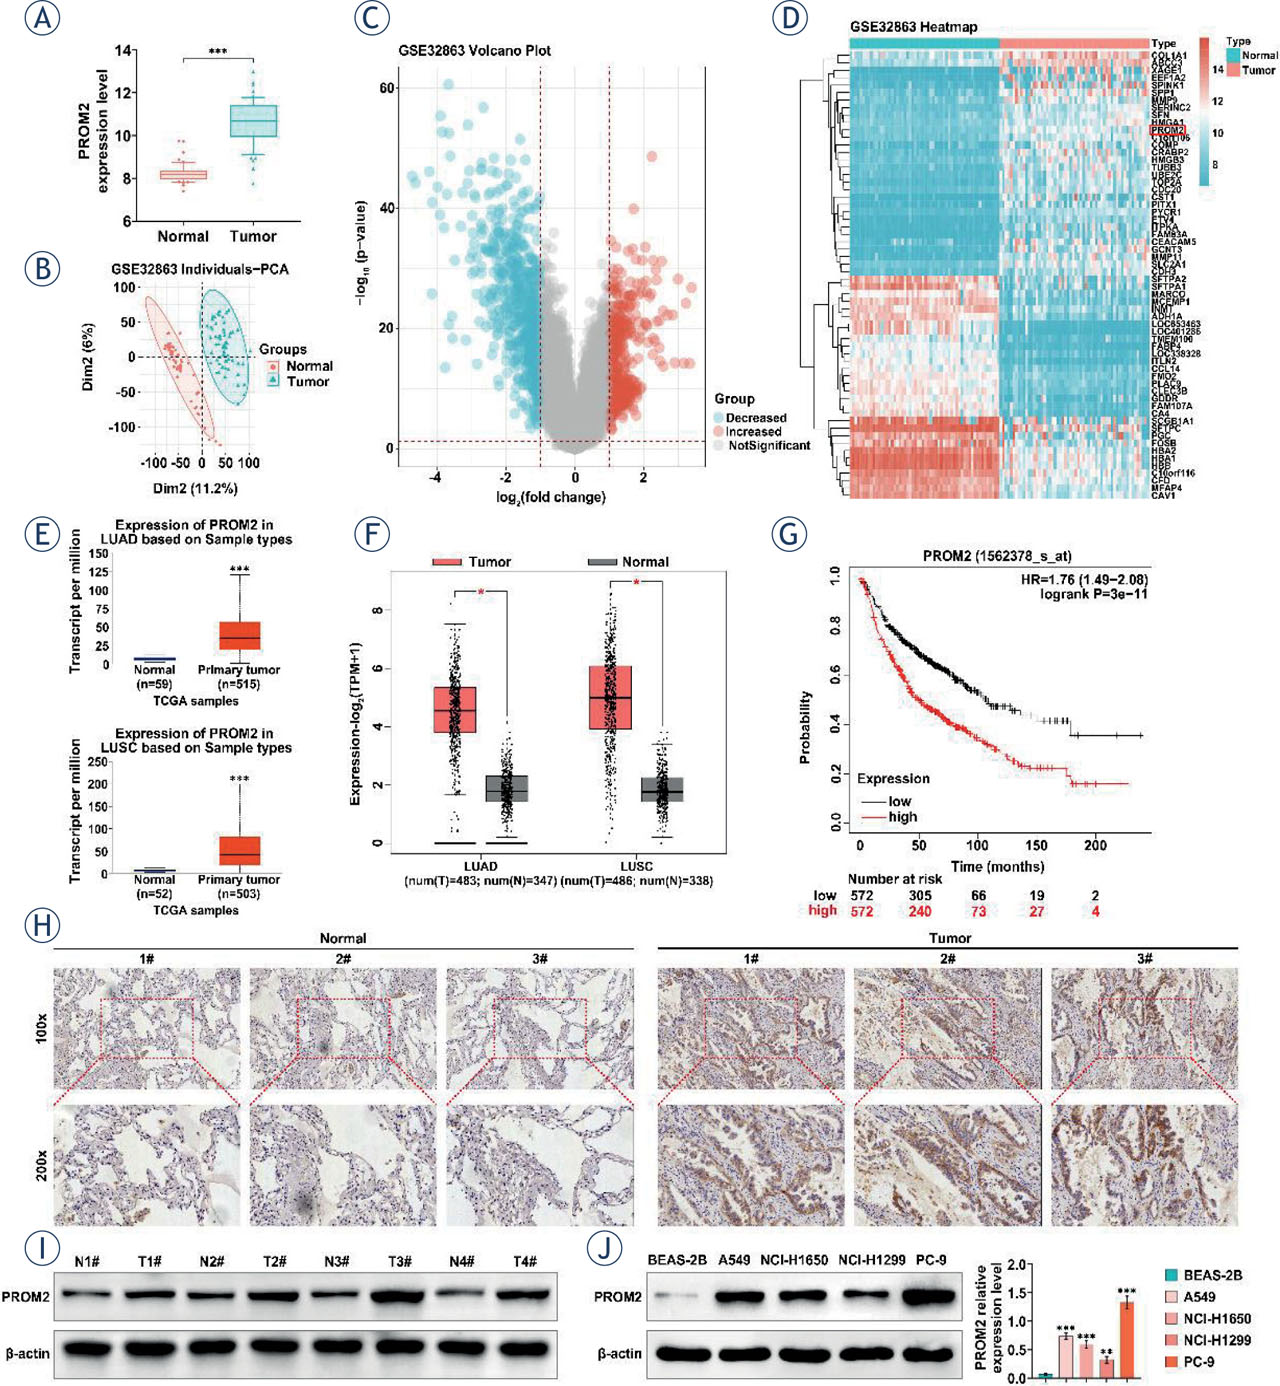
FIGURE 1.
PROM2 is overexpressed in non-small cell lung cancer (NSCLC). (A) Expression level of PROM2 in normal group and tumor. (B–D) GEO microarray data GSE32863 was analyzed by LIMMA package using R language to compare the expression of differential genes (DEGs) in lung cancer tissues and adjacent normal tissues. The data were corrected and analyzed by PCA (B), and the volcano map (C) and heat map (D) were drawn. (E–F) To analyze the expression level of PROM2 in non-small cell lung cancer (TCGA-LUAD and TCGA-LUSC) using online platform GEPIA based on TCGA database. (G) Kaplan-Meier plotter was used to analyze the effect of PROM2 expression on prognosis. (H) Representative immunohistochemical picture of PROM2 in NSCLC. (I) PROM2 protein level in NSCLC by Western blotting. (J) The protein expression of PROM2 in human normal lung epithelial cells (BEAS-2B) and lung cancer cells (NCI-H1650, A549, NCI-H1299, PC-9) was detected by western blotting.
*P < 0.05, **P < 0.01, ***P < 0.001 compared with normal group/BEAS-2B group
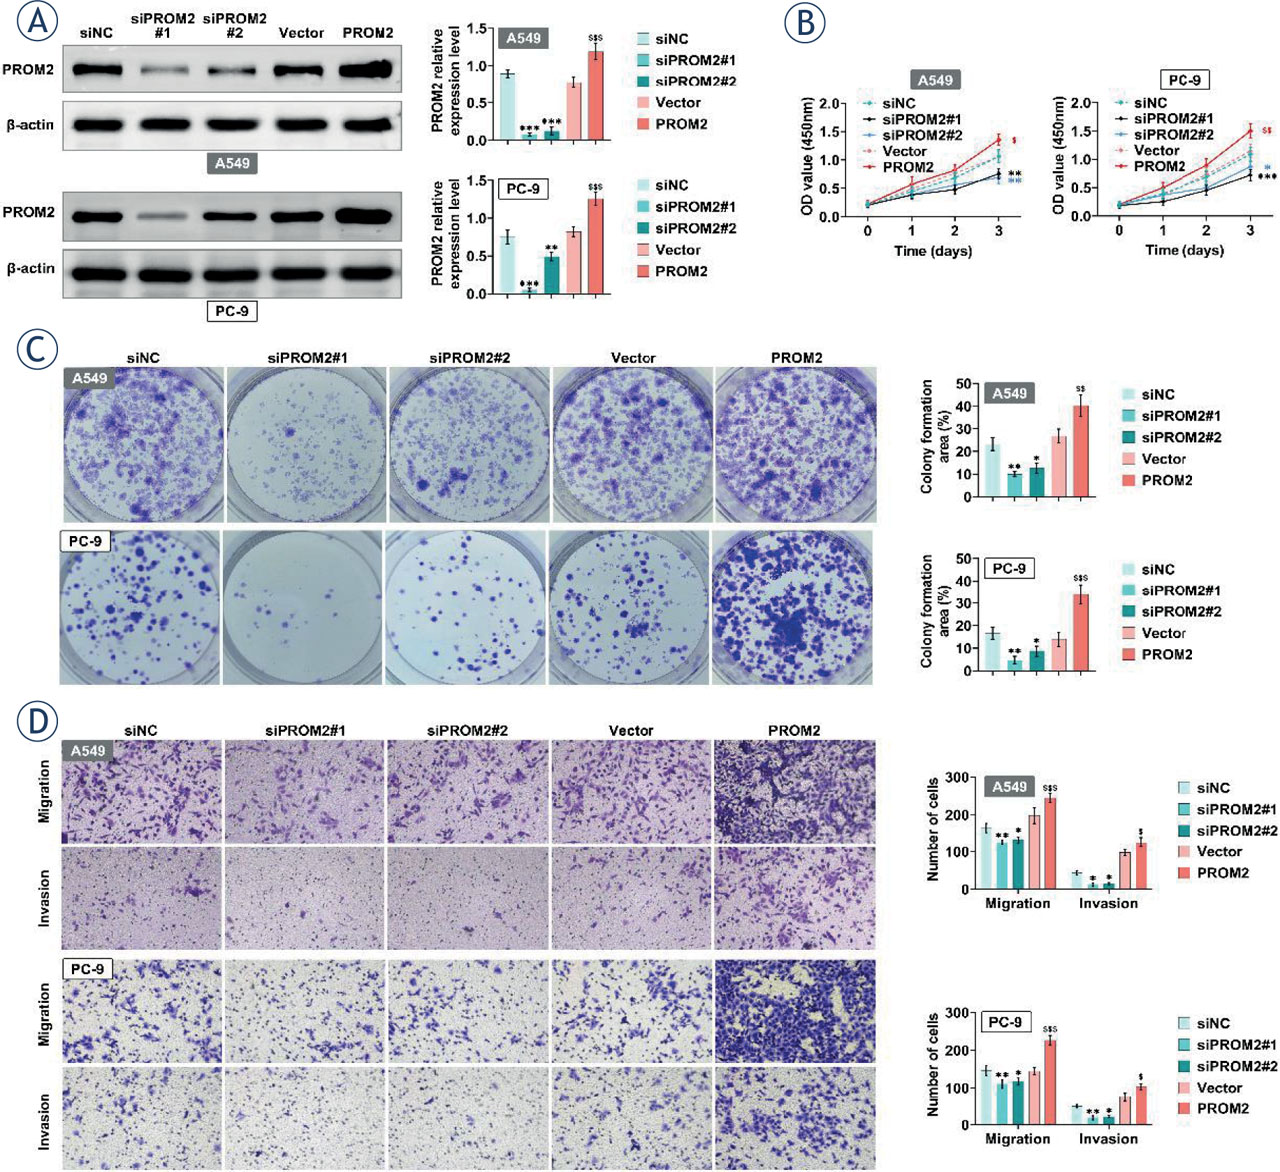
FIGURE 2.
PROM2 promotes the proliferation of lung cancer cells. (A–D) PROM2 was overexpressed or knocked down in A549 and PC-9 cells. The protein level of PROM2 was detected by western blotting (A), cell viability was detected by CCK8 (B), cell proliferation was detected by clonal formation (C). Transwell was used to detect cell migration and cell invasion (D).
*P < 0.05, **P < 0.01, ***P < 0.001 compared with siNC; $P < 0.05, $$P < 0.01, $$$P < 0.001 compared with vector
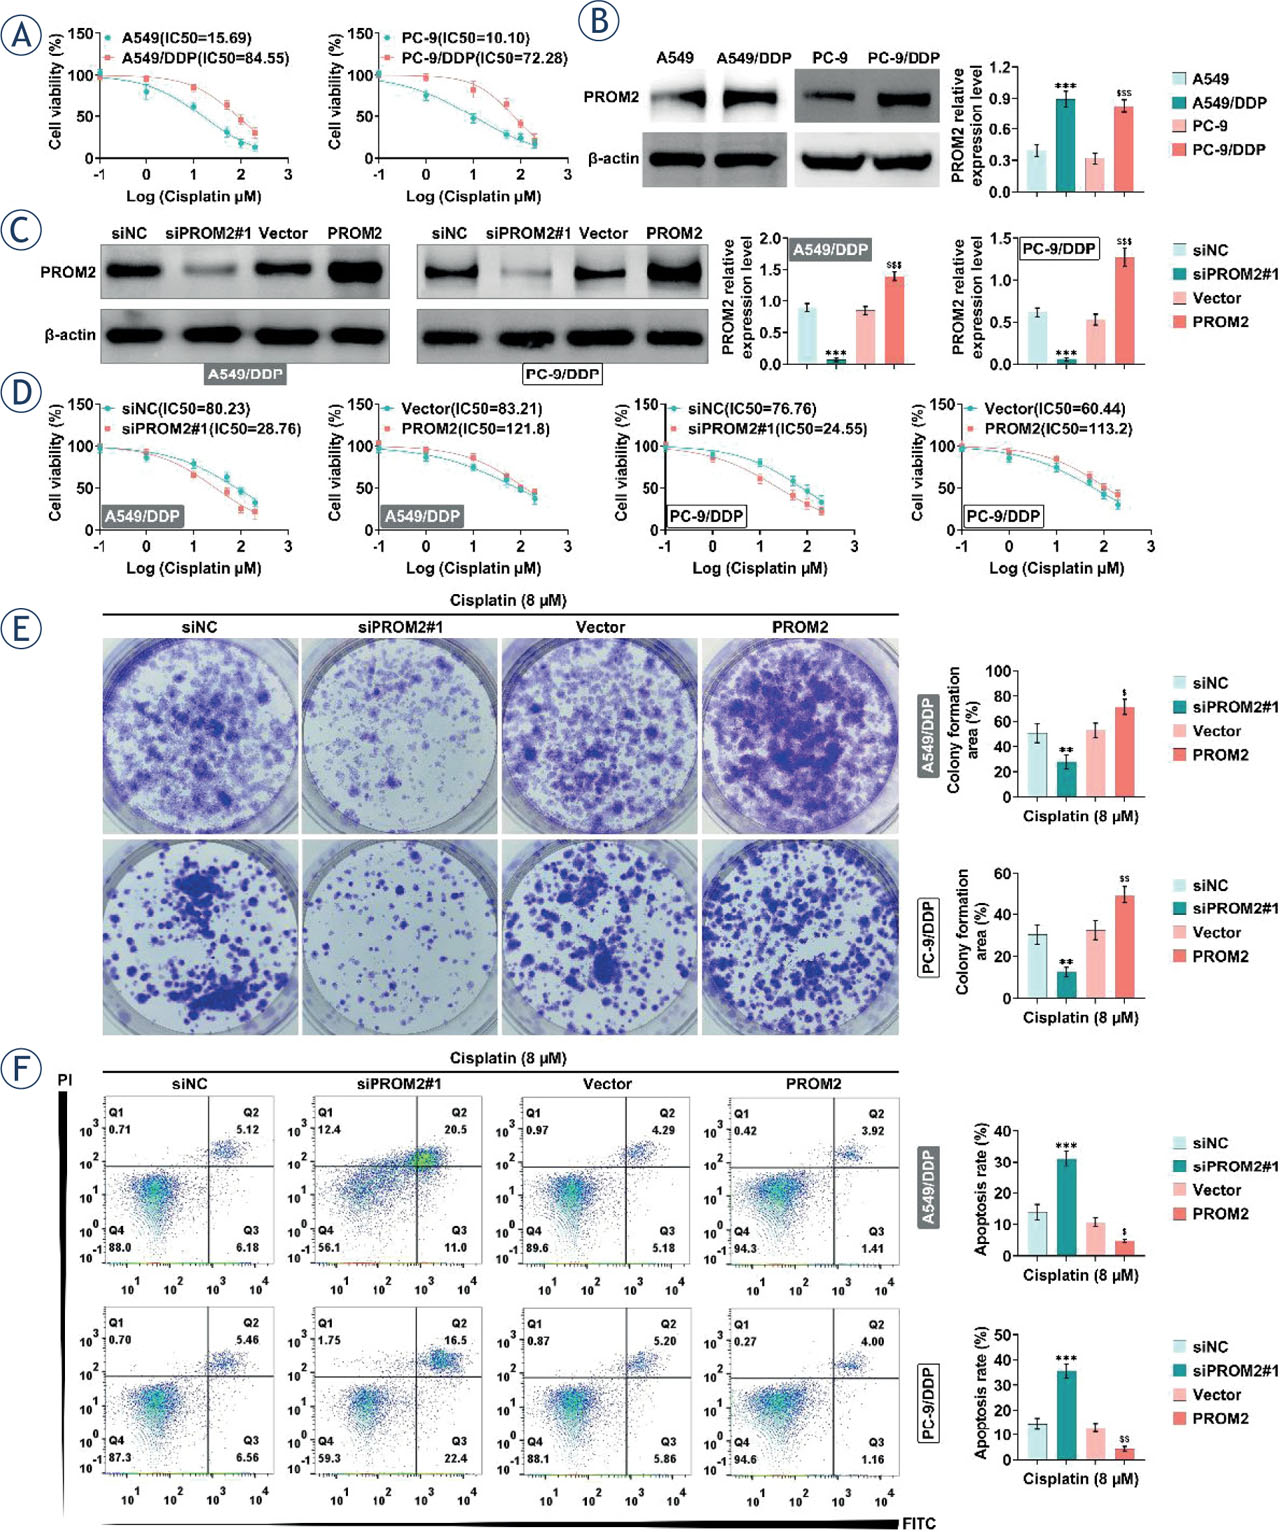
FIGURE 3.
PROM2 attenuates the sensitivity of lung cancer cells to cisplatin. (A) Cell viability was detected by CCK8. (B) The expression level of PROM2 in different groups of cells was detected by western blotting. (C–F) PROM2 was knocked down or overexpressed in A549/DDP and PC-9/DDP, and then the protein level of PROM2 was detected by western blotting, cell viability was detected by CCK8 (D), cell proliferation was detected by clone formation (E), and cell apoptosis was detected by flow cytometry (F).
**P < 0.01, ***P < 0.001 compared with A549 group; $P < 0.05, $$P < 0.01, $$$P < 0.001 compared with vector
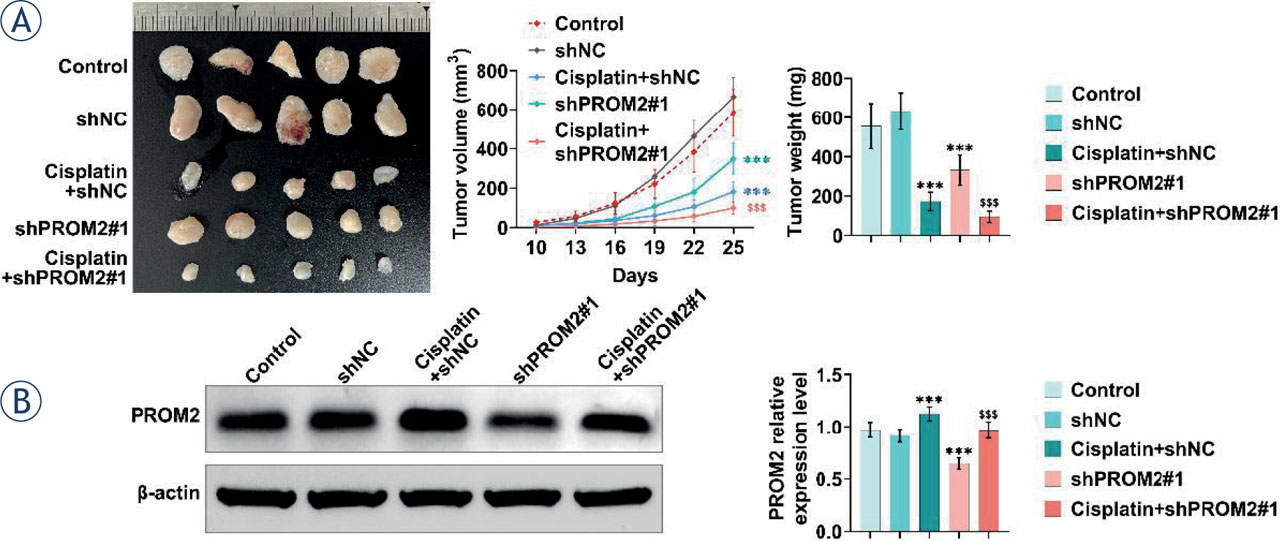
FIGURE 4.
PROM2 enhances cisplatin resistance in lung cancer cells in vivo. BALB/c nude mice were subcutaneously injected with PROM2 knockdown stable A549/DDP cells. One week later, cisplatin (4 mg/kg) was injected into the peritoneum every 3 days. After 30 days, the cells were removed and the volume and weight were measured. (A) The volume and weight of tumors in different groups were detected. (B) The protein levels of PROM2 in different groups were detected by Western blotting.
***P < 0.001 compared with shNC group; $P < 0.05, $$P < 0.01, $$$P < 0.001 compared with cisplatin+shNC
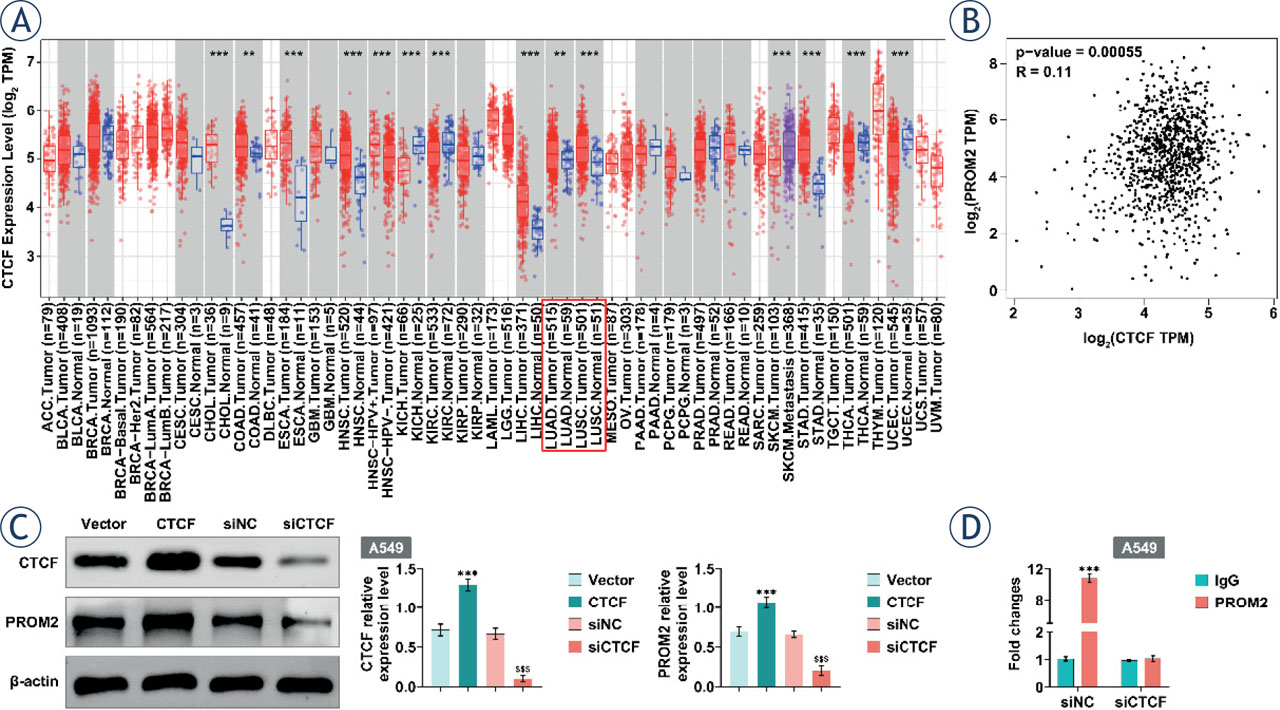
FIGURE 5.
Up-regulation of PROM2 induced by CTCF. (A) TIMER 2.0 data analysis revealed that CTCF was overexpressed in lung cancer. (B) There was a positive correlation between CTCF and PROM2 in LUAD and LUSC data analyzed by GEPIA platform. (C) Protein levels of PROM2 and CTCF were detected by western blotting. (D) The expression level of PROM2 was detected by ChIP-PCR.
**P < 0.01, ***P < 0.001 compared with vector group; $$$P < 0.001 compared with siNC
TABLE 1.
Data of ENCODE ChIP-seq
| TFs | Signal peak | ENCODE ID |
|---|---|---|
| CTCF | 114.601 | ENCFF797HKW |
| REST | 94.922 | ENCFF044DWW |
| MAFK | 71.984 | ENCFF757FDG |
| TEAD4 | 34.118 | ENCFF186WSI |
[i] ChIP-seq = transcription factor chromatin immunoprecipitation-DNA sequencing; CTCF = transcriptional repressor 11-zinc finger protein; MAFK = bZip Maf transcription factor protein; REST = neuron-restrictive silencer factor; TEAD4 = member of the transcriptional enhancer factor family; TFs = transcription factors
TABLE 2.
The patient characteristics had no statistical significance
| Clinicopathological factor | Number of cases | PROM2 expression | P value | |
|---|---|---|---|---|
| High | Low | |||
| Total Cases | 35 | 19 | 16 | |
| Gender | 0.606 | |||
| Male | 22 | 13 | 9 | |
| Female | 13 | 6 | 7 | |
| Age | 0.814 | |||
| < 60 | 17 | 9 | 8 | |
| ≥ 60 | 18 | 10 | 8 | |
| Histological type | 0.189 | |||
| LSCC | 12 | 9 | 3 | |
| LAD | 15 | 7 | 8 | |
| LCLC | 8 | 3 | 5 | |
| Pathological grading | 0.002 | |||
| I | 15 | 3 | 12 | |
| II | 11 | 8 | 3 | |
| III | 9 | 8 | 1 | |
| TNM stage | 0.006 | |||
| I | 13 | 3 | 10 | |
| II | 12 | 7 | 5 | |
| III | 10 | 9 | 1 | |
| Smoking history | 0.3320 | |||
| yes | 24 | 13 | 11 | |
| no | 11 | 6 | 5 | |
[i] LAD = lung adenocarcinoma; LCLC = non-small cell lung cancer no other specified; LSCC = squamous cell lung carcinoma
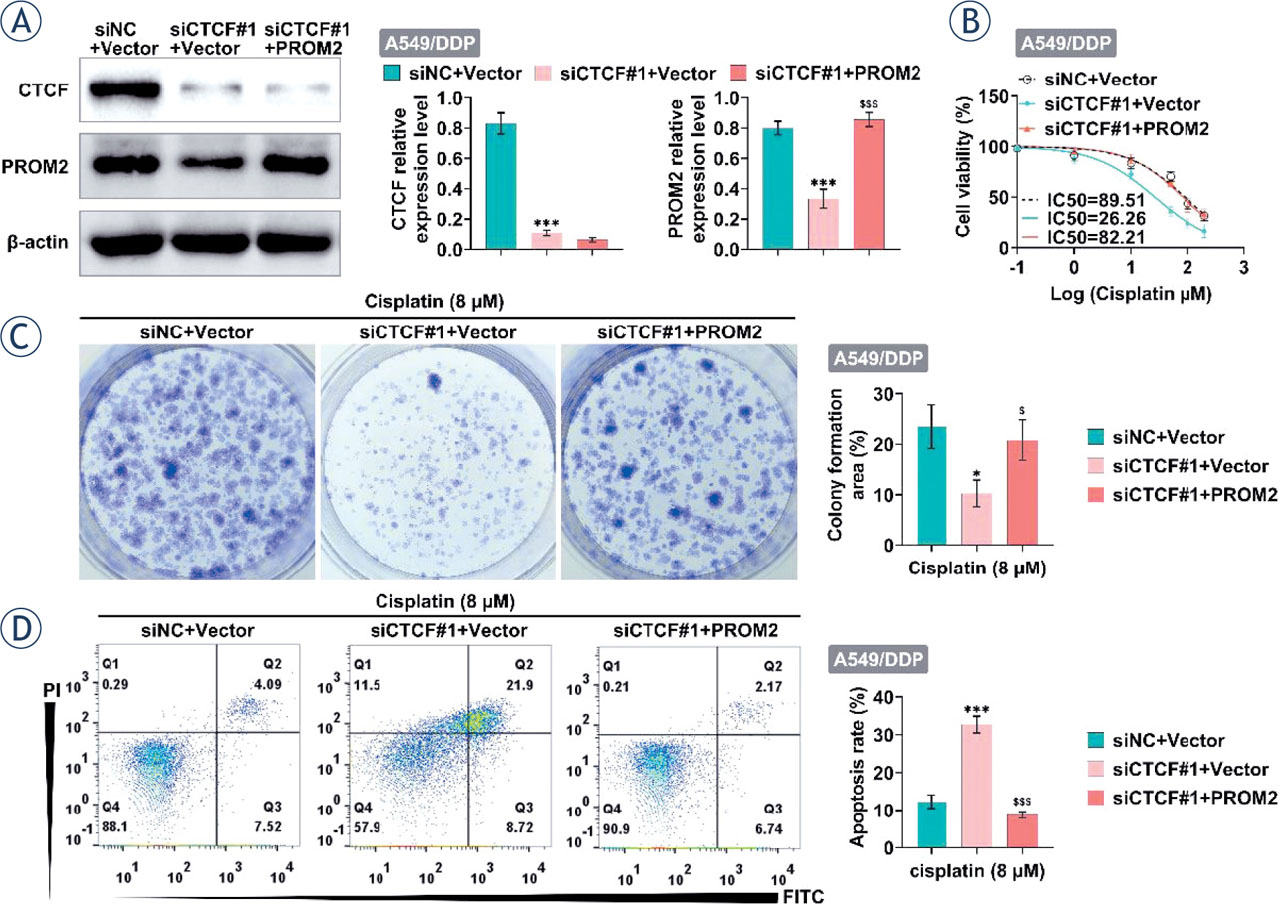
FIGURE 6.
CTCF knockdown increased the sensitivity of lung cancer cells to cisplatin by down-regulating PROM2. (A–D) After knockdown of CTCF and/or overexpression of PROM2 in A549/DDP, the protein levels of CTCF and PROM2 were detected by western blotting (A), cell viability was detected by CCK8 (B), cell proliferation was detected by clone formation (C), and cell apoptosis was detected by flow cytometry (D).
*P < 0.05, ***P < 0.001 compared with siNC+vector; $P < 0.05, $$$P < 0.001 compared with siCTCF#1+vector