
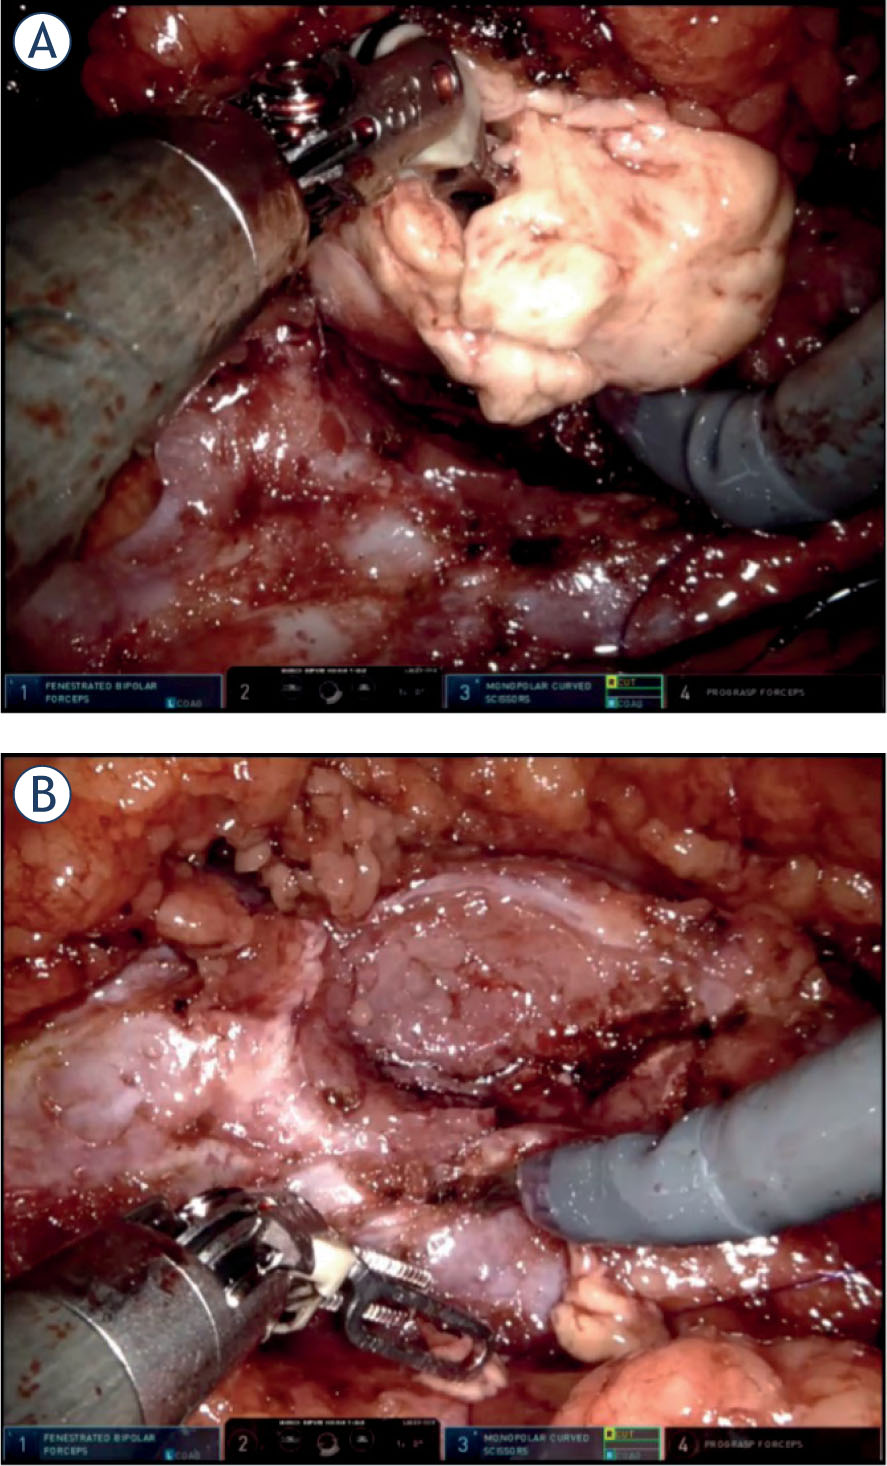
FIGURE 1.
(A) Example of tumor rupture during enucleation of a renal tumor. (B) Tumor bed after the tumor was completely removed from healthy kidney parenchyma (intraoperative snapshots).
TABLE 1.
Patient and tumor characteristics in the no tumor rupture group and the tumor rupture group
| No tumor rupture (N = 86) | Tumor rupture (N = 14) | P value | |
|---|---|---|---|
| Patients, n (%) | |||
| Male | 59 (69) | 9 (64) | 0.8 |
| Female | 27 (31) | 5 (36) | |
| Age (years), median (IQR) | 60 (52–67) | 60 (49–68) | 0.9 |
| Tumor size (mm), median (IQR) | 30 (23–40) | 37 (30–48) | 0.2 |
| RENAL nephrometry score, median (IQR)* | 7 (5–8) | 8 (6.25–9.75) | 0.028 |
| Laterality, n (%) | |||
| Right kidney | 40 (47) | 6 (43) | 0.8 |
| Left kidney | 46 (53) | 8 (57) | |
| Tumor localization, n (%) | |||
| Upper third | 24 (28) | 5(36) | 0.8 |
| Middle third | 34 (39) | 5 (36) | |
| Lower third | 28 (33) | 4 (28) | |
| Preoperative CT/MRI, n (%) | |||
| Tumor | 72 (84) | 13 (93) | 0.4 |
| Cystic | 14 (16) | 1 (7) | |
TABLE 2.
Pathologic characteristics and oncologic outcome in the no tumor rupture group and the tumor rupture group
| No tumor rupture (N = 86), n (%) | Tumor rupture (N = 14), n (%) | P value | |
|---|---|---|---|
| Histology | 0.043 | ||
| Benign | 8 (9) | 1 (7) | |
| Oncocytoma | 7 (8) | 1 (7) | |
| Clear cell RCC | 44 (51) | 2 (14) | |
| Papillary RCC | 15 (17) | 8 (57) | |
| Chromophobe RCC | 5 (6) | 1 (7) | |
| Clear cell papillary RCC | 4 (5) | 0 (0) | |
| Other types of RCC | 3 (3) | 1 (7) | |
| WHO/ISUP grade (RCC) | 0.6 | ||
| 1 | 21 (35) | 2 (25) | |
| 2 | 35 (58) | 6 (75) | |
| 3 | 4 (7) | 0 (0) | |
| Pathologic stage | 0.4 | ||
| 1a | 58 (82) | 9 (75) | |
| 1b | 9 (13) | 2 (17) | |
| 2a | 1 (1) | 1 (8) | |
| 3 | 3 (4) | 0 (0) | |
| Positive surgical margins | 1 (1) | 0 (0) | 0.7 |
| Local or distant recurrence | 0 (0) | 0 (0) |
[i] Bold indicates a significant value (P < 0.05).
[ii] ISUP = International Society of Urologic Pathologists; RCC = renal cell carcinoma; WHO = World Health Organization
TABLE 3.
Perioperative and postoperative outcomes in the no tumor rupture group and the tumor rupture group
| No tumor rupture (N = 86) | Tumor rupture (N = 14) | P value | |
|---|---|---|---|
| Operative time (min), median (IQR) | 140 (115–171) | 147 (135–168) | 0.4 |
| WIT (min), median (IQR) | 15 (12–19) | 22 (15–25) | 0.026 |
| No clamping, n (%) | 8 (9) | 0 (0) | |
| Length of stay after surgery (days), median (IQR) | 3 (2–3) | 3 (2–3) | 0.8 |
| Creatinine (μmol/L), median (IQR) | |||
| Preoperative | 80 (73–94) | 80 (77–87) | 0.9 |
| 2 days after RAPN | 80 (70–98) | 80 (75–89) | 0.6 |
| Variation | 1 (−7 to 7) | 1 (−7 to 8) | 0.7 |
| Intraoperative EBL (mL), median (IQR) | 20 (0–50) | 50 (20–100) | 0.13 |
| Hemoglobin (g/L), median (IQR) | |||
| Preoperative | 148 (140–155) | 148 (144–152) | 0.7 |
| 2 days after RAPN | 125 (119–133) | 125 (122–129) | 0.8 |
| Variation | 22 (14–27) | 25 (20–27) | 0.6 |
| Transfusions, n (%) | 3 (3) | 0 | |
| Major complications (Clavien-Dindo ≥ 3), n (%) | 2 (2) | 0 | |
| Conversions to radical nephrectomy, n (%) | 2 (2) | 0 (0) | |
[i] Bold indicates a significant value (P < 0.05).
[ii] EBL = estimated blood loss; IQR = interquartile range; RAPN = robot-assisted partial nephrectomy; WIT = warm ischemia time