
FIGURE 1.
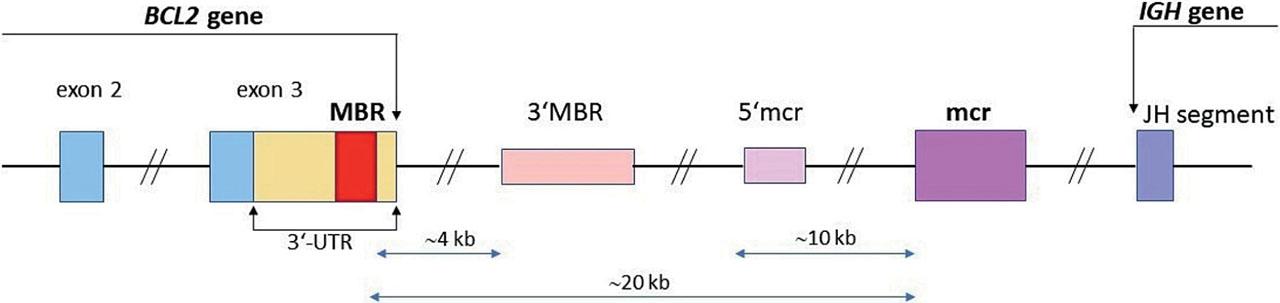
FIGURE 2.
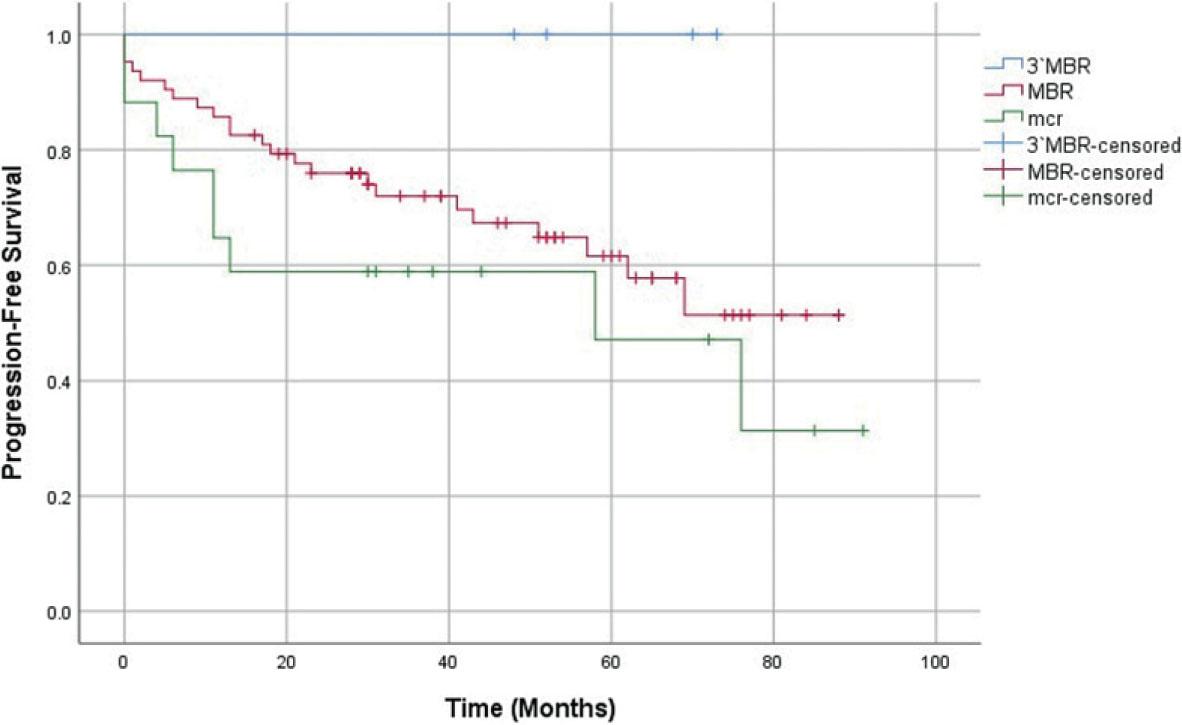
FIGURE 3.
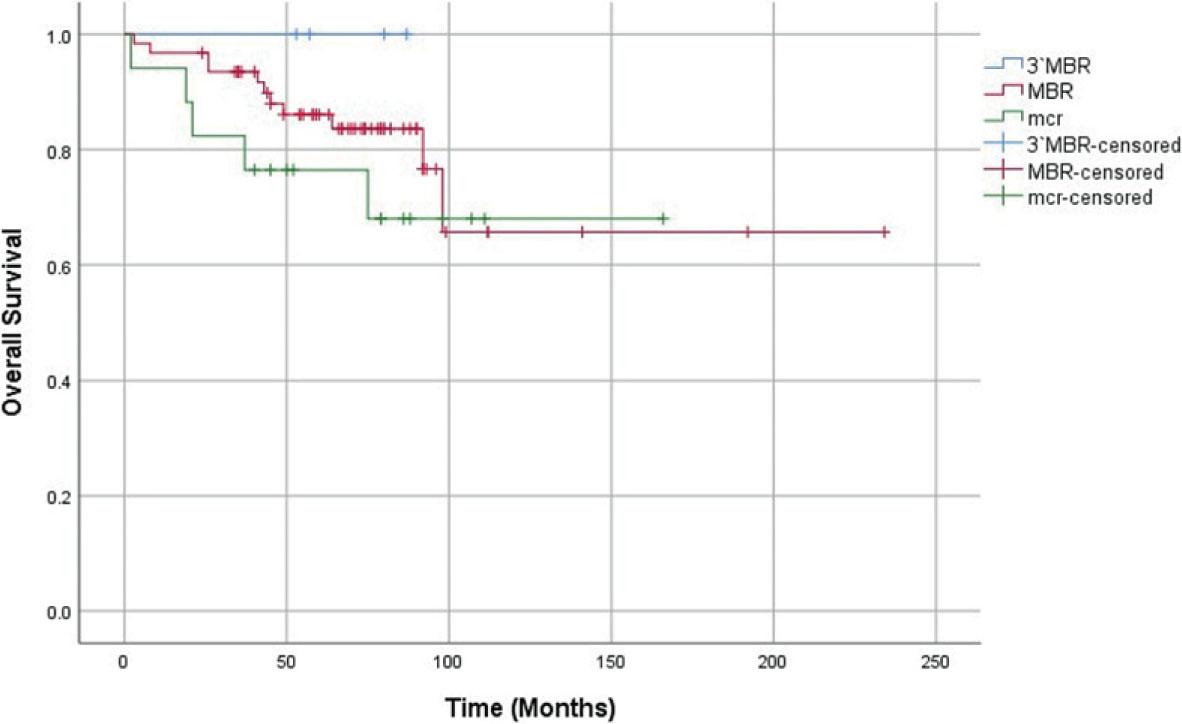
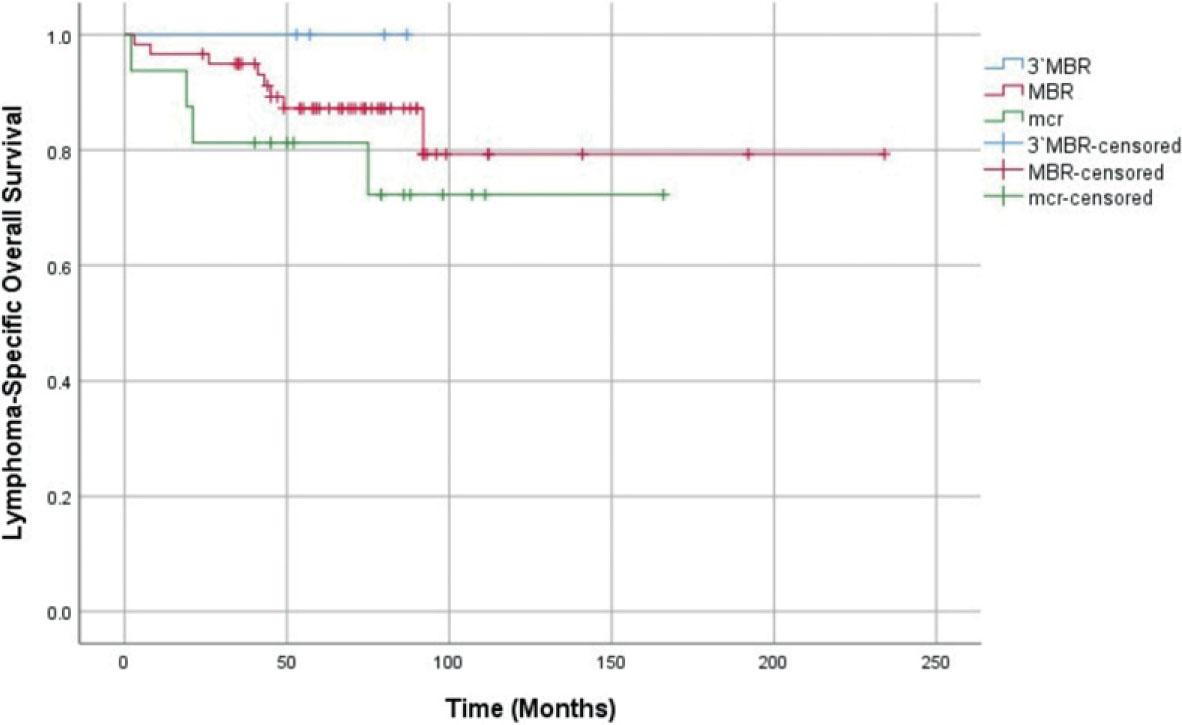
FIGURE 4.
Comparison of clinical features at diagnosis between the breakpoint-site groups (major breakpoint region [MBR], 3′MBR, mcr)
| MBR (N = 63) | 3′MBR (N = 4) | mcr (N = 17) | p1 | p2 | |
|---|---|---|---|---|---|
| Median (mean) stage | 4 (3.70) | 4 (3.75) | 4 (3.94) | 0.361 | 0.023 |
| Median (mean) FLIPI | 2 (2.51) | 3 (2.75) | 3 (3.00) | 0.226 | 0.094 |
| Median (mean) age | 61 (60.25) | 62 (63.25) | 64 (63.71) | 0.423 | 0.218 |
Sequences of primers used for detection of the t(14;18)(q32;q21) translocation_ Relative positions of primers are indicated downstream of the first nucleotide of corresponding reference sequence
| t(14;18) MBR primers | |||
|---|---|---|---|
| primer name | NCBI accession no. | position | primer sequence |
| MBR1 | AY220759.1 | (+193443) | 5′-GACCAGCAGATTCAAATCTATGG-3′ |
| MBR2 | AY220759.1 | (+192940) | 5′-ACTCTGTGGCATTATTGCATTATAT-3′ |
| t(14;18) 3′MBR primers | |||
| primer name | NCBI accession no. | position | primer sequence |
| 3′MBR1 | AH010747.2 | (+717) | 5′-GCACCTGCTGGATACAACACTG-3′ |
| 3′MBR2 | AH010747.2 | (+1530) | 5′-GGTGACAGAGCAAAACATGAACA-3′ |
| 3′MBR3 | AH010747.2 | (+1787) | 5′-GTAATGACTGGGGAGCAAATCTT-3′ |
| 3′MBR4 | AH010747.2 | (+2718) | 5′-ACTGGTTGGCGTGGTTTAGAGA-3′ |
| t(14;18) mcr primers | |||
| primer name | NCBI accession no. | position | primer sequence |
| mcr1 | AF275873.1 | (+1961) | 5′-TAGAGCAAGCGCCCAATAAATA-3′ |
| mcr2 | AF275873.1 | (+2407) | 5′-TGAATGCCATCTCAAATCCAA-3′ |
| 5′mcr | AH010747.2 | (+15849) | 5′-CCTTCTGAAAGAAACGAAAGCA-3′ |
| Consensus JH primer | |||
| primer name | NCBI accession no. | position | primer sequence |
| JH | OL807663.1 | (+239) | 3′-CCAGTGGCAGAGGAGTCCATTC-5′ |
Comparison of clinical features at diagnosis between the breakpoint-site groups (MBR, 3′MBR, mcr) using Fisher's exact test
| MBR (N = 63) | 3′MBR (N = 4) | mcr (N = 17) | p1 | p2 | |
|---|---|---|---|---|---|
| Male sex | 24 (38%) | 1 (25%) | 4 (24%) | 0.571 | 0.391 |
| Grade* 3 | 11 (20%) | 2 (50%) | 4 (25%) | 0.303 | 0.729 |
| B-symptoms | 23 (37%) | 2 (50%) | 8 (47%) | 0.641 | 0.576 |
| Bulky disease** | 17 (27%) | 1 (25%) | 2 (12%) | 0.497 | 0.335 |