
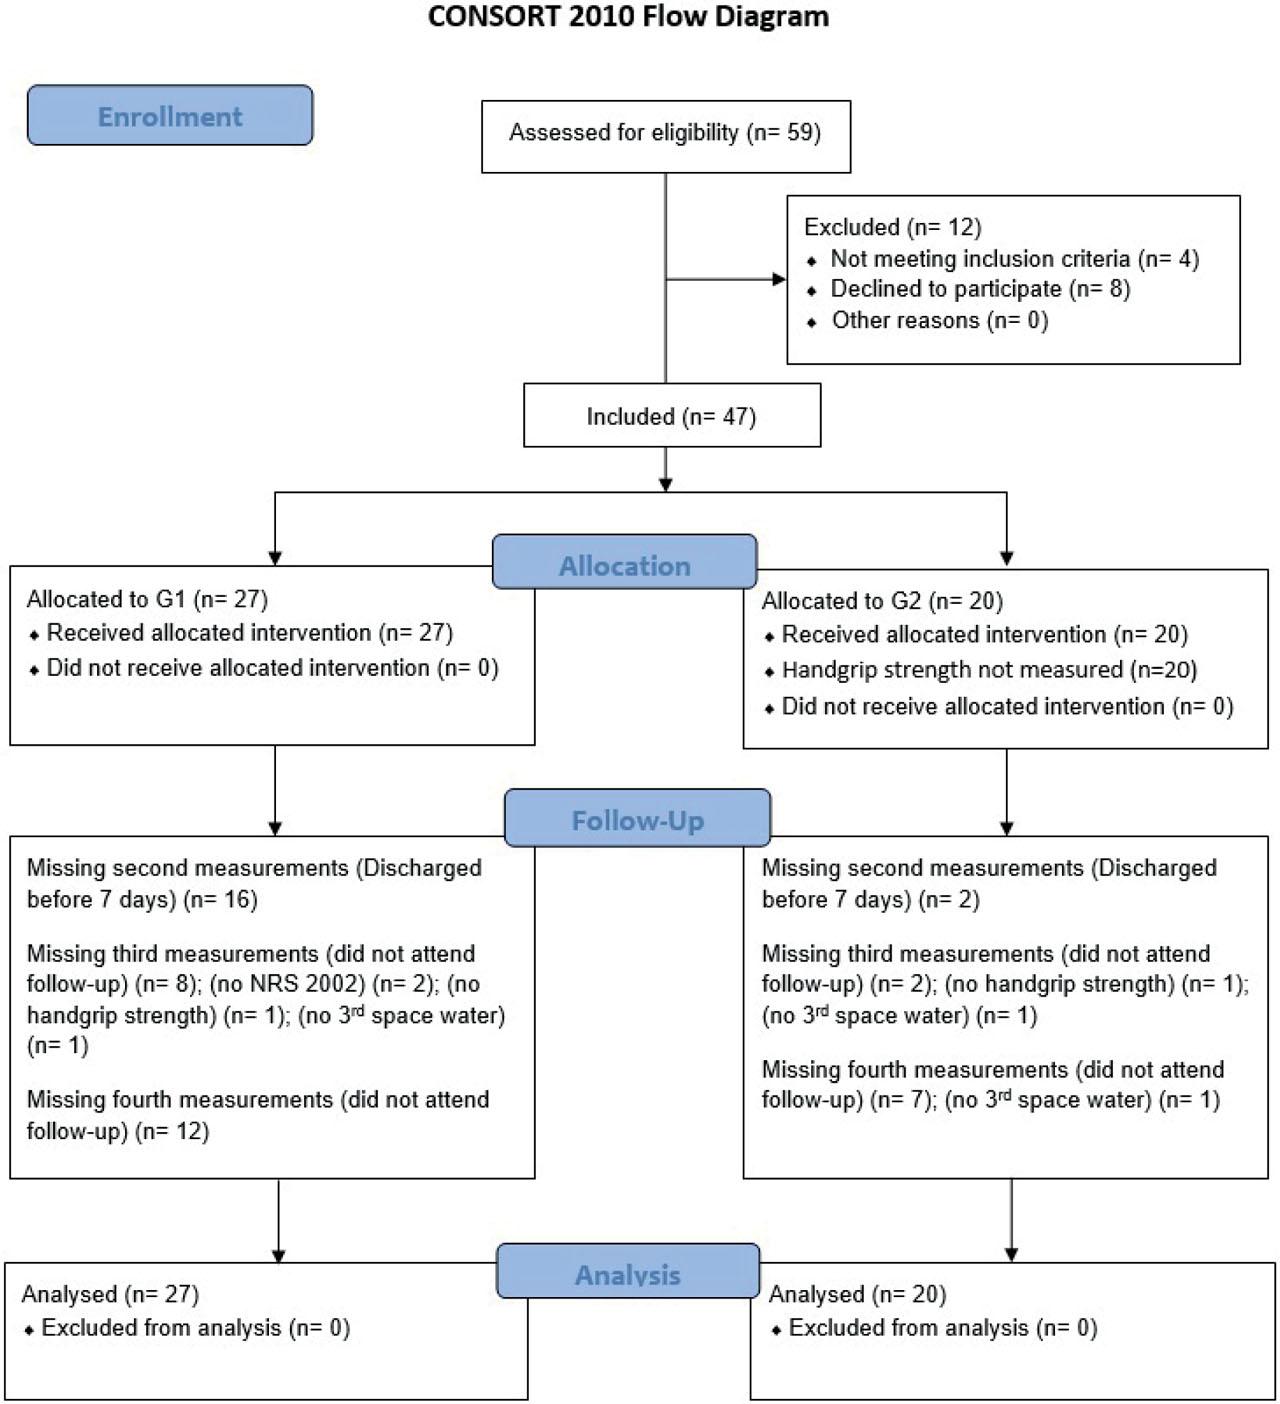
FIGURE 1.
Baseline demographic and clinical characteristics of patients (n = 47)
| Variable | All participants | G1 | G2 | P | |
|---|---|---|---|---|---|
| Sex | Male, N (%) | 33 (70.2) | 21 (77.8) | 12 (60.0) | 0.214 |
| Female, N (%) | 14 (29.8) | 6 (22.2) | 8 (40.0) | ||
| Age | Years, mean ± SD | 70.5 ± 11.2 | 70.3 ± 8.7 | 70.7 ± 12.9 | 0.477 |
| Diagnosis | GIT tumours, N (%) | 27 (57.4) | 15 (55.6) | 12 (60.0) | 1.000 |
| Tumours of liver, gallbladder, biliary system and pancreas, N (%) | 20 (42.6) | 12 (44.4) | 8 (40.0) |
Clinical characteristics of patients at different time points
| Variable | After 7 days | After 14 days | After 4 weeks | |||||||
|---|---|---|---|---|---|---|---|---|---|---|
| G1 | G2 | P | G1 | G2 | P | G1 | G2 | P | ||
| Body mass | kg median (25–75%) | 72.0 (67.8–93.2) | 76.4 (68.5–85.6) | 0.912 | 73.0 (65.0–92.0) | 75.5 (70–84.5) | 0.869 | 69.4 (66–76.8) | 75 (72.5–86.5) | 0.130 |
| BMI | kg/m2 median (25–75%) | 25.4 (22.7–36.1) | 26.8 (24.1–29.0) | 0.808 | 25 (22.5–34.1) | 26.4 (22–28.9) | 0.620 | 23.8 (21.7–27.2) | 26 (23–29.5) | 0.413 |
| Lean mass | Kg median (25–75%) | 52.0 (48.2–53.2) | 52.0 (41.9–57.1) | 0.842 | 50.1 (46.4–52.1) | 53.2 (45–58) | 0.707 | 48.4 (41.7–50.6) | 55 (46.5–60.2) | 0.065 |
| FFMI | median (25–75%) | 17.8 (16.5–20.8) | 17.4 (15.8–19.0) | 0.340 | 16.8 (15.8–19.4) | 17.4 (15.6–19.6) | 1.000 | 16.5 (15.1–17.5) | 18.8 (15.9–19.8) | 0.118 |
| Phase angle | median (25–75%) | 4.3 (3.5–4.9) | 4.4 (3.3–5.1) | 0.947 | 4.4 (4.1–5) | 4.2 (3.6–4.7) | 0.461 | 4.8 (3.7–5.3) | 4.4 (3.3–4.7) | 0.201 |
| 3rd space water | L median (25–75%) | 0.7 (−0.3–1.6) | 0.4(−0.6–1.0) | 0.642 | 0.5 (−0.–1.4) | 0.2 (−0.1–1) | 0.988 | 0.4 (−0.2 do 1.1) | 0.4 (−0.2–1.3) | 0.928 |
| NRS 2002** | Points median (25–75%) | / | 4 (3–4.3) | 4 (3–4.5) | 0.961 | 4 (3–5) | 3 (3–4) | 0.235 | ||
Clinical characteristics of patients upon enrolment into the study
| Variable | G1 | G2 | P | |
|---|---|---|---|---|
| Body mass | kg, median (25–75%) | 82.0 (70.0–98.0) | 78.5 (72.3–88.3) | 0.268 |
| BMI | kg/m2, median (25–75%) | 26.2 (23.4–34.5) | 27.5 (24.3–29.6) | 0.569 |
| Lean mass | kg, median (25–75%) | 53.1 (47.1–64.2) | 53.9 (45.0–59.6) | 0.505 |
| FFMI | median (25–75%) | 17.8 (16.4–20.3) | 17.6 (15.9–20.4) | 0.561 |
| Phase angle | °, median (25–75%) | 4.7 (4.3–5.4) | 4.6 (4.0–5.5) | 0.846 |
| 3rd space water | L, median (25–75%) | −0.1 (−0.8–1.0) | 0.4 (−0.4–0.9) | 0.425 |
| NRS 2002 | Points, median (25–75%) | 2 (0–3) | 3 (3–3,8) | 0.012 |
| Malnutrition according to GLIM | No, N (%) | 14 (51.9) | 16 (80.0) | 0.067 |
| Yes, N (%) | 13 (48.1) | 4 (20.0) |
Handgrip strength data
| Variable | Upon enrolment | After 7 days | After 14 days | After 4 weeks | ||||||
|---|---|---|---|---|---|---|---|---|---|---|
| G1 | G2 | G1 | G2 | P | G1 | G2 | P | |||
| Hand grip strength | kg, median (25–75%) | 34.1 (28.5–41.6) | / | / | 30.2 (25–35.3) | 30.3 (25.8–36.8) | 0.782 | 29.7 (23.6–32.7) | 32.6 (27.3–35.6) | 0.254 |
| Hand grip strength: norm | No, N (%) | 19 (70.4) | / | 11 (61.1) | 9 (52.9) | 0.738 | 8 (53.3) | 8 (61.5) | 0.718 | |
| Yes, N (%) | 8 (29.6) | / | 8 (47.1) | 7 (38.9) | 7 (46.7) | 5 (38.5) | ||||
| Hand grip strength: deviation | median (25–75%) | 0.2 (−0.1–1.2) | / | 0 (−0.5–0.5) | 0.3 (−0.4–1) | 0.369 | 0.1 (−0.7–0.3) | 0.3 (−0.8–.8) | 0.683 | |