
FIGURE 1.
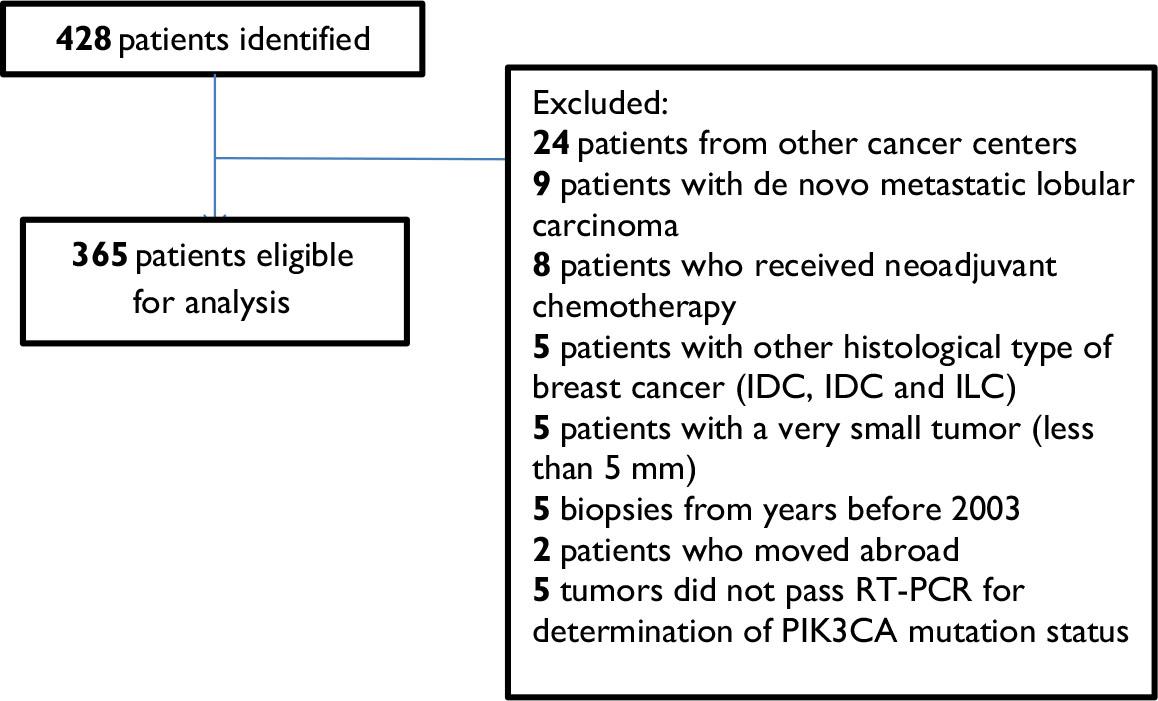
FIGURE 2.
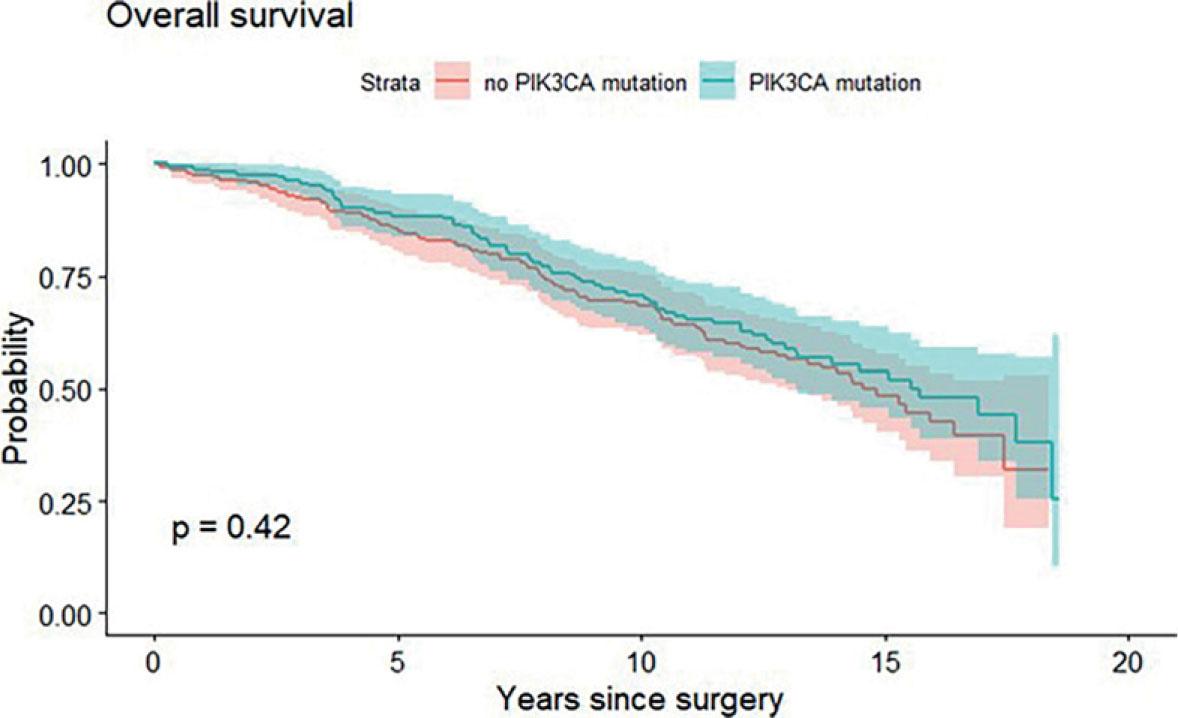
FIGURE 3.
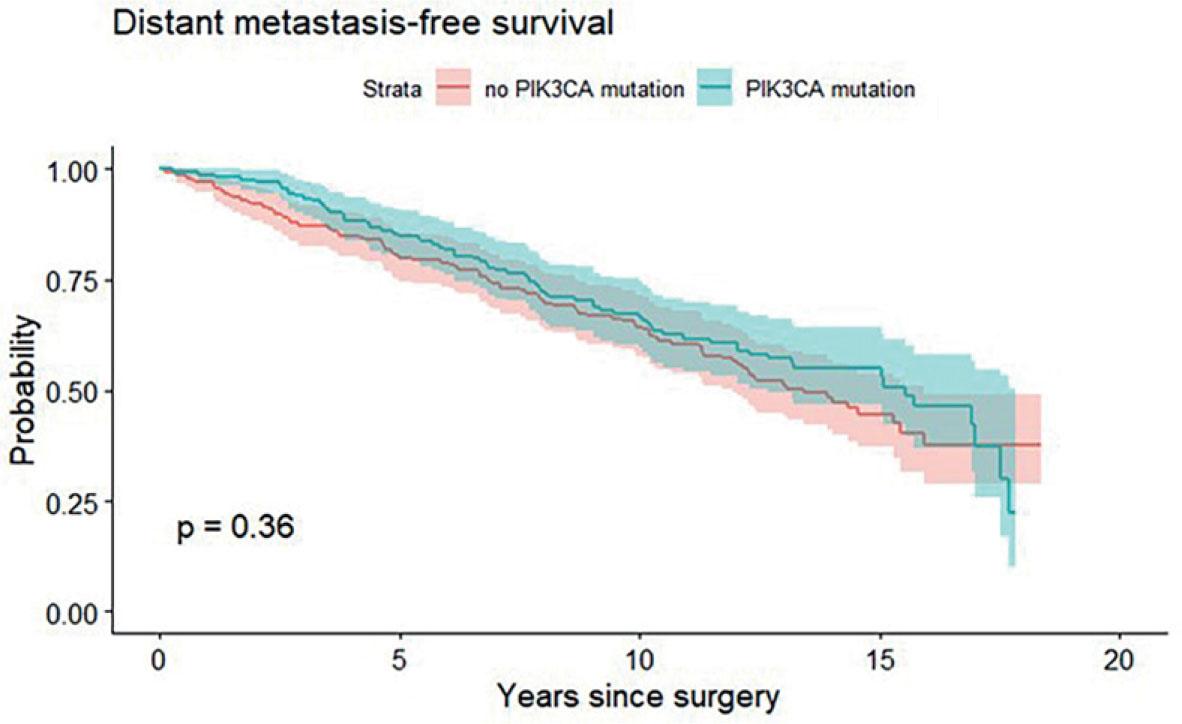
Simple Cox proportional hazards model for DMFS in the PIK3CA mutated patient cohort
| Characteristic | HR | 95% CI | Adj p |
|---|---|---|---|
| Age | 0.99 | 0.96–1.02 | 1.0 |
| Duration of TAM | 0.92 | 0.75–1.14 | 1.0 |
| Duration of AIs | 1.07 | 0.90–1.28 | 1.0 |
Distribution of systemic therapy in all patients and according to PIK3CA mutation status
| Systemic therapy | All pts | PIK3CA mutated pts | PIK3CA non-mutated pts |
|---|---|---|---|
| None | 12 (3) | 5 (3) | 7 (3) |
| ET only | 249 (68) | 115 (70) | 134 (67) |
| ChT only | 13 (4) | 5 (3) | 8 (4) |
| ET and ChT | 91 (25) | 39 (24) | 52 (26) |
| None ET | 25 (7) | 10 (6) | 15 (7) |
| ET with TAM | 106 (29) | 45 (27) | 61 (30) |
| ET with AIs | 127 (35) | 54 (33) | 73 (37) |
| Sequence TAM-AI | 107 (29) | 55 (34) | 52 (26) |
| Median duration (range) of ET | 5 (0.2–16.7) | 5 (0.4–16.7) | 5 (0.2–11.2) |
Advanced Cox proportional hazards model for OS in the PIK3CA mutated patient cohort
| Characteristic | HR | 95% CI | Adj p |
|---|---|---|---|
| Age | 1.05 | 1.02–1.08 | 0.014 |
| Tumor size | 1.38 | 0.90–2.10 | 0.84 |
| Grade | |||
| G1 | Ref | ||
| G2 | 1.41 | 0.59–3.38 | 1.0 |
| G3 | 5.52 | 1.67–18.18 | 0.04 |
| Ki-67 | 0.94 | 0.72–1.22 | 1.0 |
| PR | 1 | 0.99–1.01 | 1.0 |
| PIK3CA status | |||
| Other than exon 20 | Ref | ||
| Only exon 20 | 1.32 | 0.79–2.21 | 1.0 |
| No. of positive axillary LNs | 1.58 | 1.32–1.88 | < 0.001 |
| Duration of TAM | 0.68 | 0.55–0.86 | 0.01 |
| Duration of AI | 0.73 | 0.60–0.88 | 0.01 |
Characteristics of the included patients and their tumors
| Characteristic | All patients (n = 365; 100%) | PIK3CA mutated (n = 164; 45%) | PIK3CA non-mutated (n = 201; 55%) |
|---|---|---|---|
| Median age (range) (yrs) | 62.8 (33–90) | 63.1 | 62.4 |
| Median tumor size (mm) | 21 | 19 | 21 |
| Nodal status | |||
| N0 | 209 (57) | 100 (61) | 109 (54) |
| N1 | 84 (23) | 37 (22) | 47 (23) |
| N2 | 26 (7) | 1 (7) | 15 (8) |
| N3 | 46 (13) | 16 (10) | 30 (15) |
| Tumor grade | |||
| G1 | 52 (14) | 20 (12) | 32 (16) |
| G2 | 270 (74) | 134 (82) | 136 (68) |
| G3 | 43 (12) | 10 (6) | 33 (16) |
| IHC* subtype | |||
| ER+/PR+/HER2− | 299 (82) | 136 (46) | 159 (54) |
| ER+/PR−/HER2− | 39 (11) | 14 (36) | 25 (64) |
| HER2 + | 20 (6) | 9 (45) | 11 (55) |
| ER−/PR−/HER2− | 7 (2) | 2 (29) | 5 (71) |
| Median Ki-67 (range) (%) | 3 (1–50) | 2.5 (1–50) | 3 (1–40) |
| Mitotic score | |||
| M1 | 284 (78) | 138 (84) | 146 (73) |
| M2 | 55 (15) | 19 (12) | 36 (18) |
| M3 | 26 (7) | 7 (4) | 19 (9) |
| Presence of LVI | 24 (7) | 4 (2) | 20 (10) |
| Median TILs (range) (%) | 3 (1–50) | 3 | 3 |
| Median follow-up time (range) (yrs) | 10.8 (0.1–18.6) | 10.8 | 10.7 |
Advanced Cox proportional hazards model for DMFS in the PIK3CA mutated patient cohort
| Characteristic | HR | 95% CI | Adj p |
|---|---|---|---|
| Age | 1.01 | 0.97–1.05 | 1.0 |
| Tumor size | 0.99 | 0.57–1.71 | 1.0 |
| Grade | |||
| G1 | Ref | ||
| G2 | 0.91 | 0.26–3.22 | 1.0 |
| G3 | 1.03 | 0.16–6.83 | 1.0 |
| Ki-67 | 1.35 | 0.93–1.95 | 1.0 |
| PR | 1 | 0.99–1.02 | 1.0 |
| PIK3CA status | |||
| Other than exon 20 | Ref | ||
| Only exon 20 | 2.19 | 1.01–4.80 | 0.582 |
| No. of positive axillary LNs | 1.64 | 1.30–2.06 | < 0.001 |
| Duration of TAM | 1.02 | 0.81–1.29 | 1.0 |
| Duration of AIs | 1.06 | 0.87–1.28 | 1.0 |
Simple Cox proportional hazards model for OS in the PIK3CA mutated patient cohort
| Characteristic | HR | 95% CI | Adj p |
|---|---|---|---|
| Age | 1.05 | 1.02–1.07 | < 0.001 |
| Duration of TAM | 0.73 | 0.61–0.88 | 0.002 |
| Duration of AIs | 0.79 | 0.67–0.93 | 0.005 |