FIGURE 1.
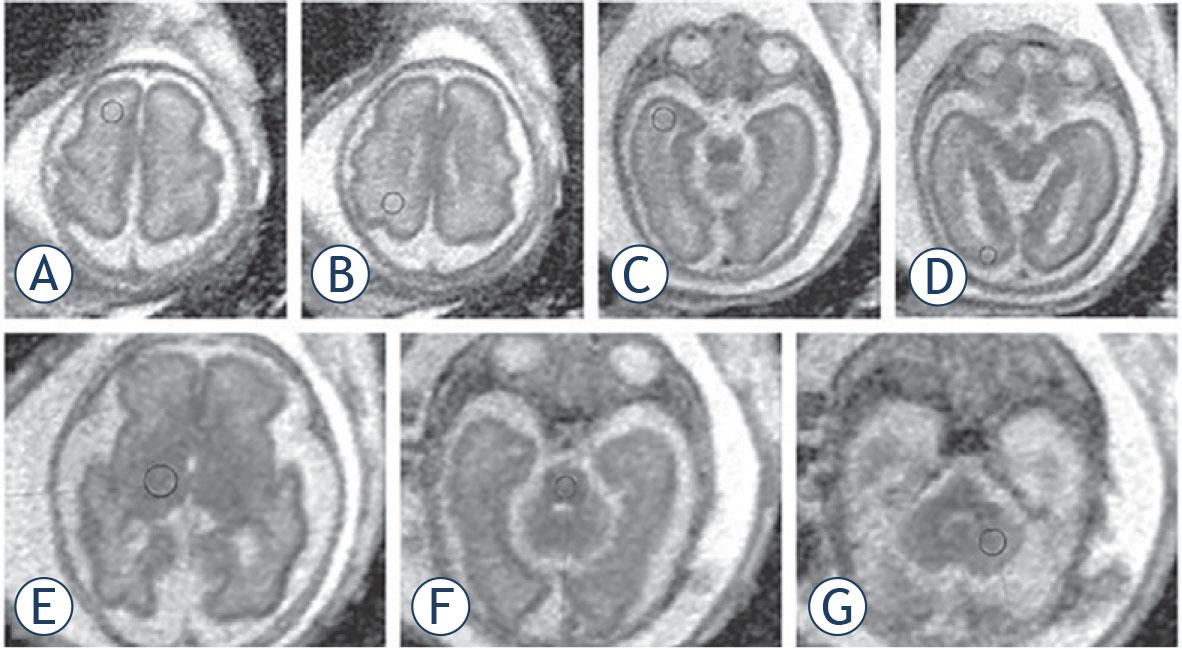
FIGURE 2.
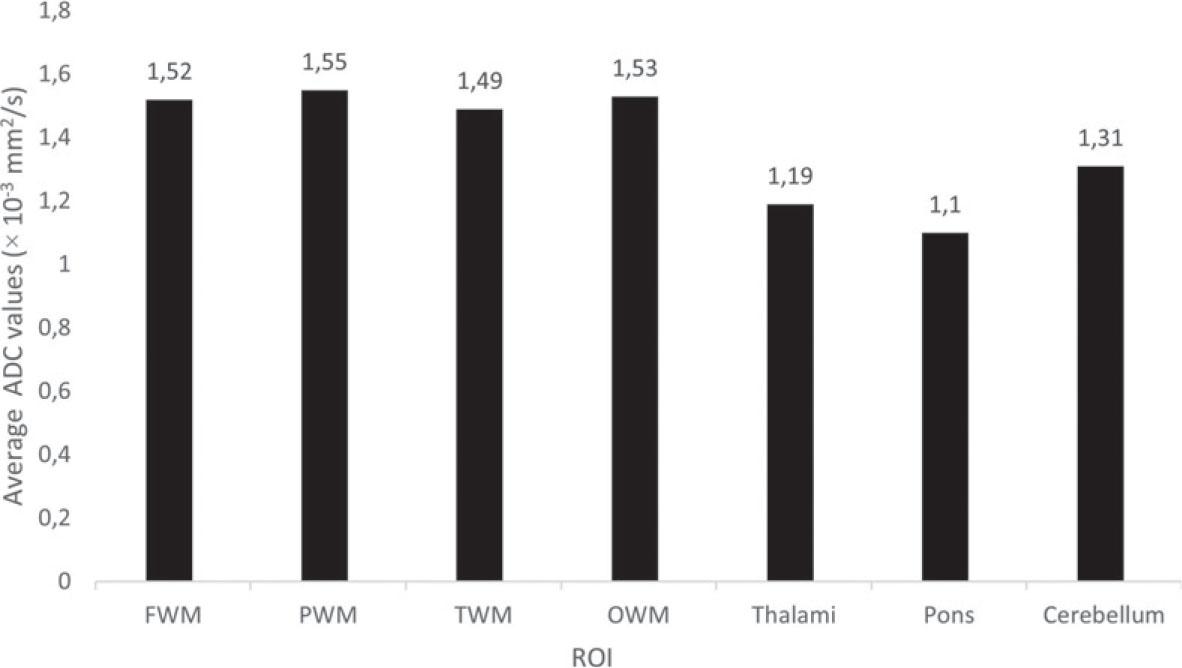
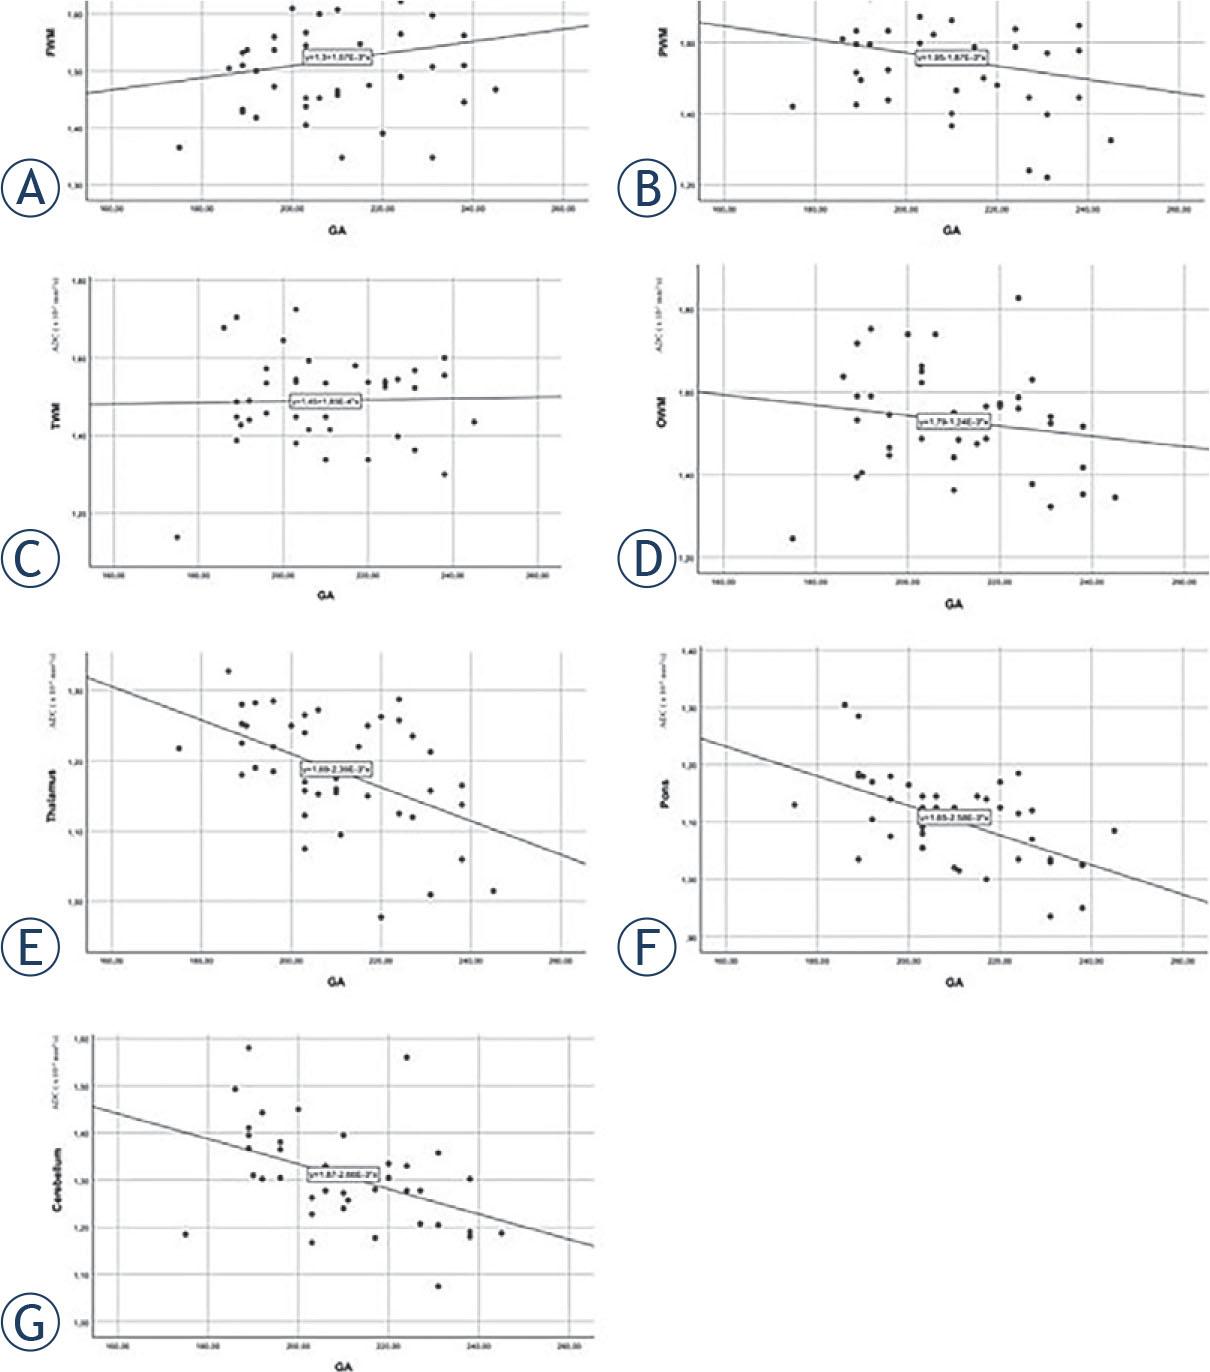
FIGURE 3.
Intraclass correlation coefficient (ICC) for different regions of interest (ROIs)
| ROI | ICC |
|---|---|
| FWM | 0.91 |
| PWM | 0.90 |
| TWM | 0.75 |
| OWM | 0.78 |
| Thalami | 0.85 |
| Pons | 0.81 |
| Cerebellum | 0.92 |

| ROI | ICC |
|---|---|
| FWM | 0.91 |
| PWM | 0.90 |
| TWM | 0.75 |
| OWM | 0.78 |
| Thalami | 0.85 |
| Pons | 0.81 |
| Cerebellum | 0.92 |
© 2023 Lucija Kobal, Katarina Surlan Popovic, Jernej Avsenik, Tina Vipotnik Vesnaver, published by Association of Radiology and Oncology
This work is licensed under the Creative Commons Attribution 4.0 License.