
FIGURE 1
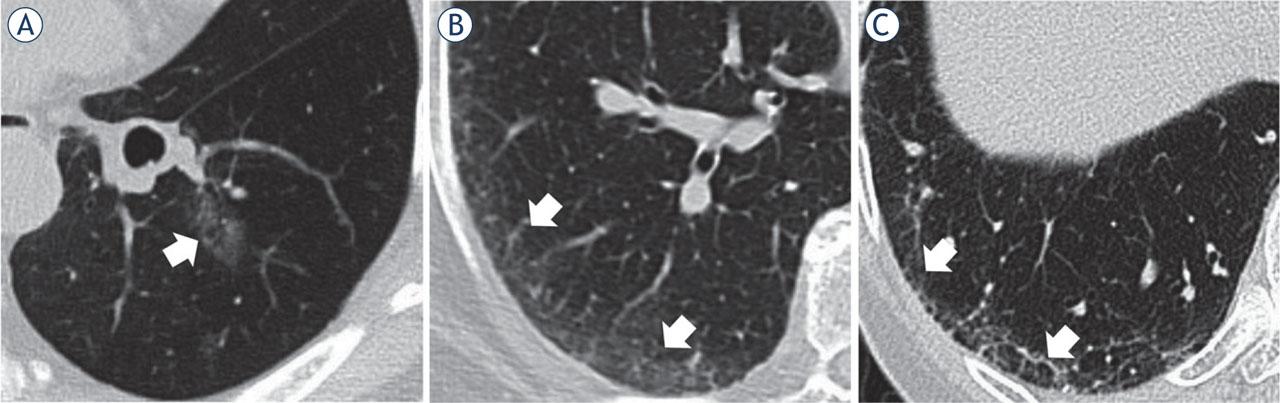
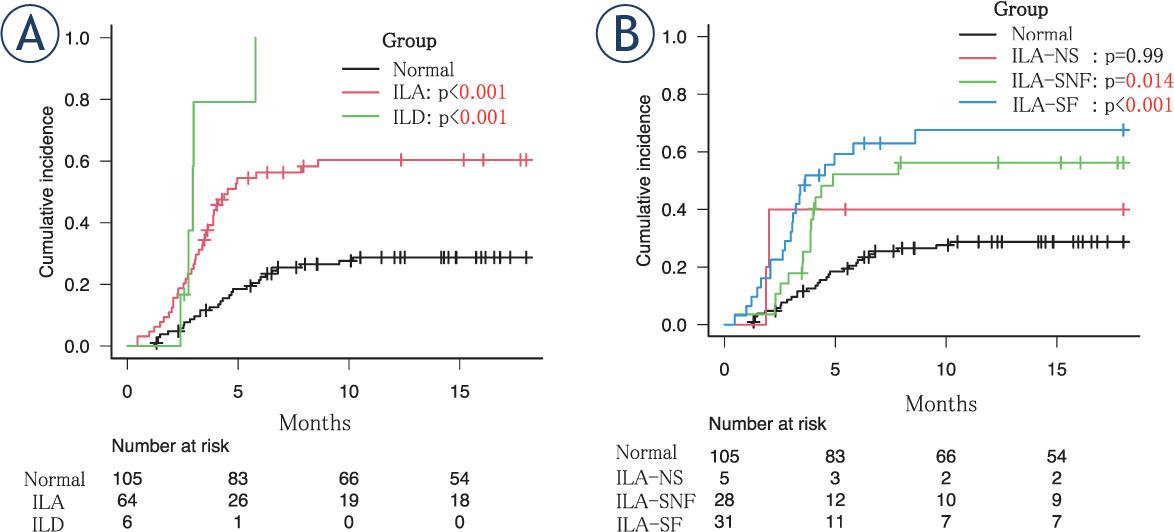
FIGURE 2
Characteristics of patients treated with radical-intent radiotherapy
| Characteristic | Normal (n = 87) | ILA-SF (n = 24) | p |
|---|---|---|---|
| Age (years) | 69 (41–90) | 73 (60–82) | 0.09 |
| Performance status | – | – | 0.39 |
| 0 | 41 (47%) | 12 (50%) | – |
| 1 | 36 (41%) | 8 (33%) | – |
| 2 | 6 (7%) | 4 (17%) | – |
| 3 | 4 (5%) | 0 (0%) | – |
| Pack year | 45 (0–171) | 53 (0–122) | 0.38 |
| KL-6 (U/mL) | 294 (151–1607) | 399 (208–705) | 0.91 |
| Pathology | – | – | 0.09 |
| Adenocarcinoma | 46 (53%) | 7 (29%) | – |
| Squamous cell carcinoma | 35 (40%) | 14 (58%) | – |
| Others | 6 (7%) | 3 (13%) | – |
| Lower-lobe primary lesion | 19 (22%) | 6 (25%) | 0.79 |
| T classification | – | – | 0.36 |
| 1 | 13 (15%) | 1 (4%) | – |
| 2 | 23 (26%) | 10 (42%) | – |
| 3 | 19 (22%) | 5 (21%) | – |
| 4 | 32 (37%) | 8 (33%) | – |
| Concurrent chemotherapy | 58 (67%) | 13 (54%) | 0.33 |
| Durvalumab | 15 (17%) | 1 (4%) | 0.19 |
| Mutation | 8 (13%) | 3 (18%) | 0.70 |
| Median follow-up: survivors (years) | 2.8 (0.6–12.1) | 1.5 (0.7–6.0) | 0.46 |
Univariate and multivariate analyses for overall and progression-free survival rates
| Parameter | Overall survival | Progression-free survival | ||||||
|---|---|---|---|---|---|---|---|---|
| Univariate | Multivariate | Univariate | Multivariate | |||||
| HR (95% CI) | P | HR (95% CI) | p | HR (95% CI) | p | HR (95% CI) | p | |
| ILA-SF | 2.59 (1.51–4.43) | <0.001 | 3.07 (1.17–8.10) | 0.02 | 1.88 (1.16–3.05) | 0.01 | 1.95 (0.91–4.14) | 0.08 |
| Age (years) | 1.02 (0.99–1.04) | 0.09 | 0.95 (0.91–0.99) | 0.04 | 1.01 (0.98–1.03) | 0.59 | – | – |
| Sex (men) | 1.21 (0.70–2.10) | 0.49 | – | – | 0.91 (0.58–1.45) | 0.71 | – | – |
| Performance status (0,1 vs. 2,3) | 1.90 (1.07–3.39) | 0.03 | 0.82 (0.19–3.38) | 0.78 | 2.81 (1.66–4.78) | <0.001 | 1.35 (0.46–3.93) | 0.59 |
| Pack year | 1.01 (1.00–1.01) | 0.04 | 1.01 (0.99–1.02) | 0.14 | 1.00 (0.99–1.01) | 0.67 | – | – |
| %VC (%) | 0.99 (0.98–1.01) | 0.56 | – | – | 0.99 (0.98–1.01) | 0.51 | – | – |
| FEV1 (L) | 0.84 (0.55–1.29) | 0.43 | – | – | 0.92 (0.62–1.36) | 0.68 | – | – |
| FEV1/FVC (%) | 0.99 (0.97–1.02) | 0.92 | – | – | 1.01 (0.98–1.02) | 0.75 | – | – |
| KL-6 (U/mL) | 1.00 (0.99–1.01) | 0.11 | 1.00 (0.99–1.01) | 0.34 | 1.01 (1.00–1.02) | 0.03 | 1.00 (0.99–1.01) | 0.40 |
| Pathology (adenocarcinoma) | 0.46 (0.31–0.69) | <0.001 | 0.18 (0.08–0.44) | <0.001 | 0.54 (0.36–0.79) | 0.002 | 0.34 (0.18–0.65) | 0.001 |
| Lower-lobe primary lesion | 1.60 (1.02–2.53) | 0.04 | 1.03 (0.39–2.68) | 0.95 | 1.09 (0.72–1.65) | 0.69 | – | – |
| T classification (T4 vs. others) | 1.15 (0.74–1.79) | 0.53 | – | – | 1.47 (0.99–2.17) | 0.05 | 1.53 (0.78–2.99) | 0.21 |
| N classification (positive) | 1.02 (0.49–2.12) | 0.95 | – | – | 0.88 (0.48–1.60) | 0.67 | – | – |
| Concurrent chemotherapy | 0.51 (0.33–0.80) | 0.004 | 0.19 (0.07–0.56) | 0.002 | 0.60 (0.41–0.89) | 0.01 | 0.65 (0.31–1.30) | 0.22 |
| Durvalumab | 0.22 (0.08–0.60) | 0.003 | 0.43 (0.11–1.69) | 0.22 | 0.34 (0.18–0.65) | 0.001 | 0.40 (0.17–0.93) | 0.03 |
| PD-L1 (positive) | 0.77 (0.39–1.50) | 0.44 | – | – | 1.03 (0.59–1.79) | 0.92 | – | – |
| Mutation | 0.76 (0.47–1.22) | 0.26 | – | – | 0.96 (0.64–1.42) | 0.83 | – | – |
| Radiotherapy method (IMRT) | 0.75 (0.43–1.30) | 0.31 | – | – | 0.86 (0.55–1.34) | 0.50 | – | – |
| ENI | 0.83 (0.49–1.38) | 0.47 | – | – | 0.99 (0.64–1.56) | 0.99 | – | – |
| Lung dose | ||||||||
| V5 (%) | 0.45 (0.12–1.72) | 0.24 | – | – | 0.56 (0.19–1.66) | 0.30 | – | – |
| V10 (%) | 0.37 (0.06–2.27) | 0.29 | – | – | 0.44 (0.10–1.92) | 0.28 | – | – |
| V20 (%) | 0.36 (0.02–5.27) | 0.46 | – | – | 0.23 (0.02–2.27) | 0.21 | – | – |
| Mean (Gy) | 0.98 (0.93–1.04) | 0.48 | – | – | 0.97 (0.93–1.02) | 0.29 | – | – |
Univariate and multivariate analyses of the cumulative incidence of grade ≥ 2 radiation pneumonitis
| Parameter | Univariate analysis | Multivariate analysis | ||
|---|---|---|---|---|
| HR (95% CI) | p | HR (95% CI) | p | |
| ILA | 2.95 (1.81–4.82) | <0.001 | 2.33 (1.18–4.61) | 0.01 |
| Age (years) | 1.02 (0.99–1.05) | 0.14 | 0.99 (0.95–1.03) | 0.78 |
| Sex (men) | 1.02 (0.57–1.84) | 0.94 | – | – |
| Performance status (0,1 vs. 2,3) | 1.17 (0.56–2.44) | 0.68 | – | – |
| Pack year | 1.01 (0.99–1.01) | 0.27 | – | – |
| %VC (%) | 0.99 (0.98–1.01) | 0.96 | – | – |
| FEV1 (L) | 1.01 (0.64–1.55) | 0.99 | – | – |
| FEV1/FVC (%) | 0.99 (0.97–1.01) | 0.67 | – | – |
| KL-6 (U/mL) | 1.00 (0.99–1.01) | 0.09 | 1.00 (0.99–1.01) | 0.13 |
| Pathology (adenocarcinoma) | 0.58 (0.35–0.96) | 0.04 | 0.85 (0.42–1.72) | 0.65 |
| Lower-lobe primary lesion | 1.22 (0.69–2.12) | 0.49 | – | – |
| T classification (T4 vs. others) | 0.81 (0.47–1.39) | 0.44 | – | – |
| N classification (positive) | 1.18 (0.51–2.72) | 0.70 | – | – |
| Concurrent chemotherapy | 1.17 (0.72–1.88) | 0.53 | – | – |
| Durvalumab | 1.32 (0.72–2.40) | 0.37 | – | – |
| PD-L1 | 1.11 (0.54–2.25) | 0.78 | – | – |
| Mutation | 1.24 (0.62–2.49) | 0.54 | – | – |
| Radiotherapy method (IMRT) | 0.69 (0.39–1.19) | 0.18 | 0.38 (0.16–0.91) | 0.03 |
| ENI | 1.06 (0.65–1.75) | 0.81 | – | – |
| Lung dose | ||||
| V5 (%) | 2.14 (0.67–6.82) | 0.19 | * | * |
| V10 (%) | 3.93 (0.85–18.2) | 0.08 | * | * |
| V20 (%) | 34.8 (3.05–396.4) | 0.004 | 54.8 (1.52–1977.0) | 0.03 |
| Mean (Gy) | 1.10 (1.04–1.17) | <0.001 | * | * |
Clinical details of eight patients with grade 5 radiation pneumonitis
| Case | Age | ILA subcategory | Radiotherapy method | Concurrent chemotherapy | Durvalumab | Lung V20 (%) | Mean lung dose (Gy) | Days to death |
|---|---|---|---|---|---|---|---|---|
| 1 | 64 | SF | IMRT | Yes | No | 19.2 | 12.8 | 104 |
| 2 | 73 | SF | 3DCRT | Yes | No | 21.4 | 13.9 | 210 |
| 3 | 73 | SF | IMRT | No | No | 30.6 | 15.7 | 123 |
| 4 | 76 | SF | IMRT | Yes | Yes | 34.1 | 17.9 | 155 |
| 5 | 77 | SNF | 3DCRT | No | No | 33.2 | 16.5 | 155 |
| 6 | 79 | SF | IMRT | Yes | No | 31.5 | 17.3 | 160 |
| 7 | 79 | SF | 3DCRT | No | No | 19.4 | 9.7 | 40 |
| 8 | 80 | SF | 3DCRT | No | No | 27.6 | 15.2 | 99 |
Patient characteristics
| Characteristic | Normal (n = 105) | ILA (n = 64) | ILD (n = 6) | p |
|---|---|---|---|---|
| Age (years) | 71 (41–90) | 72 (60–86) | 74 (63–86) | 0.01 |
| Sex (men) | 82 (78%) | 52 (81%) | 6 (100%) | 0.70 |
| Performance status | – | – | – | 0.42 |
| 0 | 53 (50%) | 37 (58%) | 4 (66%) | – |
| 1 | 41 (39%) | 19 (30%) | 1 (17%) | – |
| 2 | 7 (7%) | 7 (11%) | 1 (17%) | – |
| 3 | 4 (4%) | 1 (1%) | 0 (0%) | – |
| Pack year | 45 (0–171) | 47 (0–122) | 48.5 (20–84) | 0.98 |
| Pulmonary function test | ||||
| %VC (%) | 99.1 (41.8–144.2) | 103.0 (41.8–147.5) | 86.9 (55.7–98.8) | 0.08 |
| FEV1 (L) | 1.9 (0.6–3.6) | 2.2 (0.9–3.5) | 2.0 (1.5–2.1) | 0.12 |
| FEV1/FVC (%) | 69.2 (34.1–98.1) | 69.8 (36.0–85.0) | 74.8 (62.2–86.8) | 0.36 |
| KL-6 (U/mL) | 282 (151–3957) | 370 (172–896) | 393 (204–859) | 0.65 |
| Pathology | – | – | – | 0.01 |
| Adenocarcinoma | 59 (56%) | 21 (33%) | 2 (33%) | – |
| Squamous cell carcinoma | 40 (38%) | 38 (59%) | 4 (67%) | – |
| Others | 6 (6%) | 5 (8%) | 0 (0%) | – |
| Lower-lobe primary lesion (radical-intent) | 19 (22%) | 14 (33%) | 3 (75%) | 0.20 |
| TNM classification (radical-intent) | ||||
| T classification | – | – | – | 0.53 |
| 1 | 13 (15%) | 3 (7%) | 0 (0%) | – |
| 2 | 23 (26%) | 12 (28%) | 2 (50%) | – |
| 3 | 19 (22%) | 13 (30%) | 0 (0%) | – |
| 4 | 32 (37%) | 15 (35%) | 2 (50%) | – |
| N classification | – | – | – | 0.32 |
| 0 | 7 (9%) | 8 (19%) | 0 (0%) | – |
| 1 | 16 (18%) | 8 (19%) | 1 (25%) | – |
| 2 | 42 (48%) | 16 (37%) | 2 (50%) | – |
| 3 | 22 (25%) | 11 (26%) | 1 (25%) | – |
| Stage | – | – | – | 0.40 |
| II A | 3 (3%) | 1 (2%) | 0 (0%) | – |
| II B | 5 (6%) | 6 (14%) | 0 (0%) | – |
| III A | 34 (39%) | 15 (35%) | 3 (75%) | – |
| III B | 36 (41%) | 14 (33%) | 0 (0%) | – |
| III C | 9 (11%) | 7 (16%) | 1 (25%) | – |
| Concurrent chemotherapy | 65 (62%) | 33 (52%) | 2 (33%) | 0.20 |
| Carboplatin + paclitaxel | 30 (46%) | 18 (55%) | 2 (100%) | – |
| Cisplatin + docetaxel | 22 (34%) | 8 (24%) | 0 (0%) | – |
| Cisplatin + vinorelbine | 13 (20%) | 7 (21%) | 0 (0%) | – |
| Durvalumab | 17 (16%) | 9 (14%) | 0 (0%) | 0.83 |
| PD-L1 (positive) | 36 (34%) | 23 (36%) | 0 (0%) | 0.99 |
| Mutation | – | – | – | 0.99 |
| EGFR | 8 (7%) | 5 (8%) | 1 (17%) | – |
| ALK | 6 (6%) | 2 (3%) | 1 (17%) | – |
| None/unknown | 91 (87%) | 57 (89%) | 4 (66%) | – |
| Radiotherapy method | – | – | – | 0.08 |
| 3DCRT | 80 (76%) | 40 (63%) | 5 (83%) | – |
| IMRT | 25 (24%) | 24 (37%) | 1 (17%) | – |
| ENI | 77 (73%) | 38 (59%) | 4 (67%) | 0.06 |
| Hypofractionated radiotherapy | 3 (3%) | 3 (5%) | 0 (0%) | 0.67 |
| Dose escalation | 6 (6%) | 5 (8%) | 0 (0%) | 0.75 |
| Lung dose | ||||
| V5 (%) | 34.5 (4.3–90.8) | 40.3 (5.8–95.7) | 34.6 (10.6–66.8) | 0.18 |
| V10 (%) | 27.1 (2.7–67.7) | 32.4 (3.7–81.4) | 27.8 (8.8–49.9) | 0.19 |
| V20 (%) | 19.8 (1.1–44.8) | 22.0 (1.0–48.0) | 22.6 (7.3–33.0) | 0.59 |
| Mean (Gy) | 10.8 (1.7–23.5) | 11.8 (2.0–19.6) | 12.3 (3.8–18.0) | 0.53 |
| Median follow-up (years) | 1.8 (0.1–12.1) | 1.3 (0.1–9.9) | 0.9 (2.1–3.9) | 0.06 |
| Median follow-up: survivors (years) | 2.9 (0.6–12.1) | 1.9 (0.6–9.9) | 0.9 (0.9–0.9) | 0.51 |