
Table 1
Review of studies evaluating electrochemotherapy in vulvar cancer
| OR | NR | ||||
|---|---|---|---|---|---|
| Perrone, 201320 | 8 | 84y | 8 SCC | 6/8 (75%) | 2/8 (25%) |
| Perrone, 201521 | 25 | 85y | 25 SCC | 20/25 (80%) | 5/20 (20%) |
| Pellegrino, 201618 | 10 | 68y | 1 9 Paget’s SCC | 6/10 (60%) | 4/10 (40%) |
| Perrone, 201913 | 55 | 79y | 57 SCC 3 Paget’s 1 melanoma | 46/55 (84%) | 9/55 (16%) |
| Corrado, 202016 | 15 | 83y | 14 1 SCC CS | 12/15 (80%) | 3/15 (20%) |
[i] CS = carcinosarcoma; No = number; NR = no response; OR = objective response; SCC = squamous cell carcinoma; y = year(s)
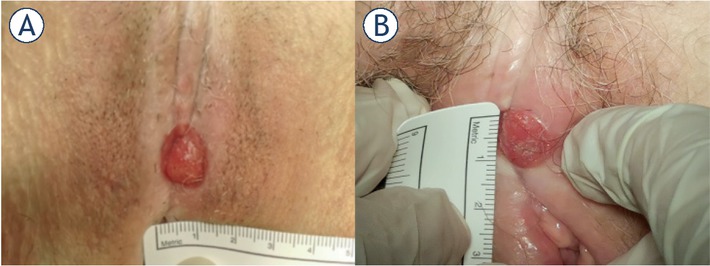
Figure 1
(A) Local recurrence of vulvar cancer. (B) No response to treatment two months after electrochemotherapy.
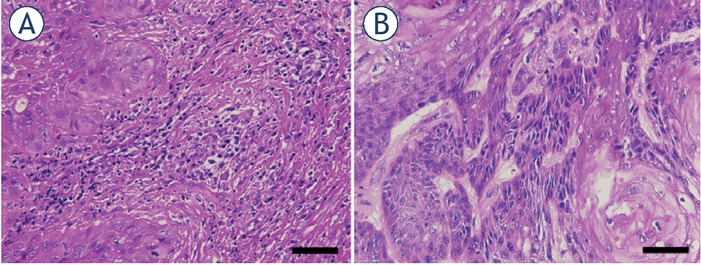
Figure 2
Hematoxylin and eosin stained sections of primary (A) and post-electrochemotherapy (B) biopsy. Scale bar represents 50 μm.
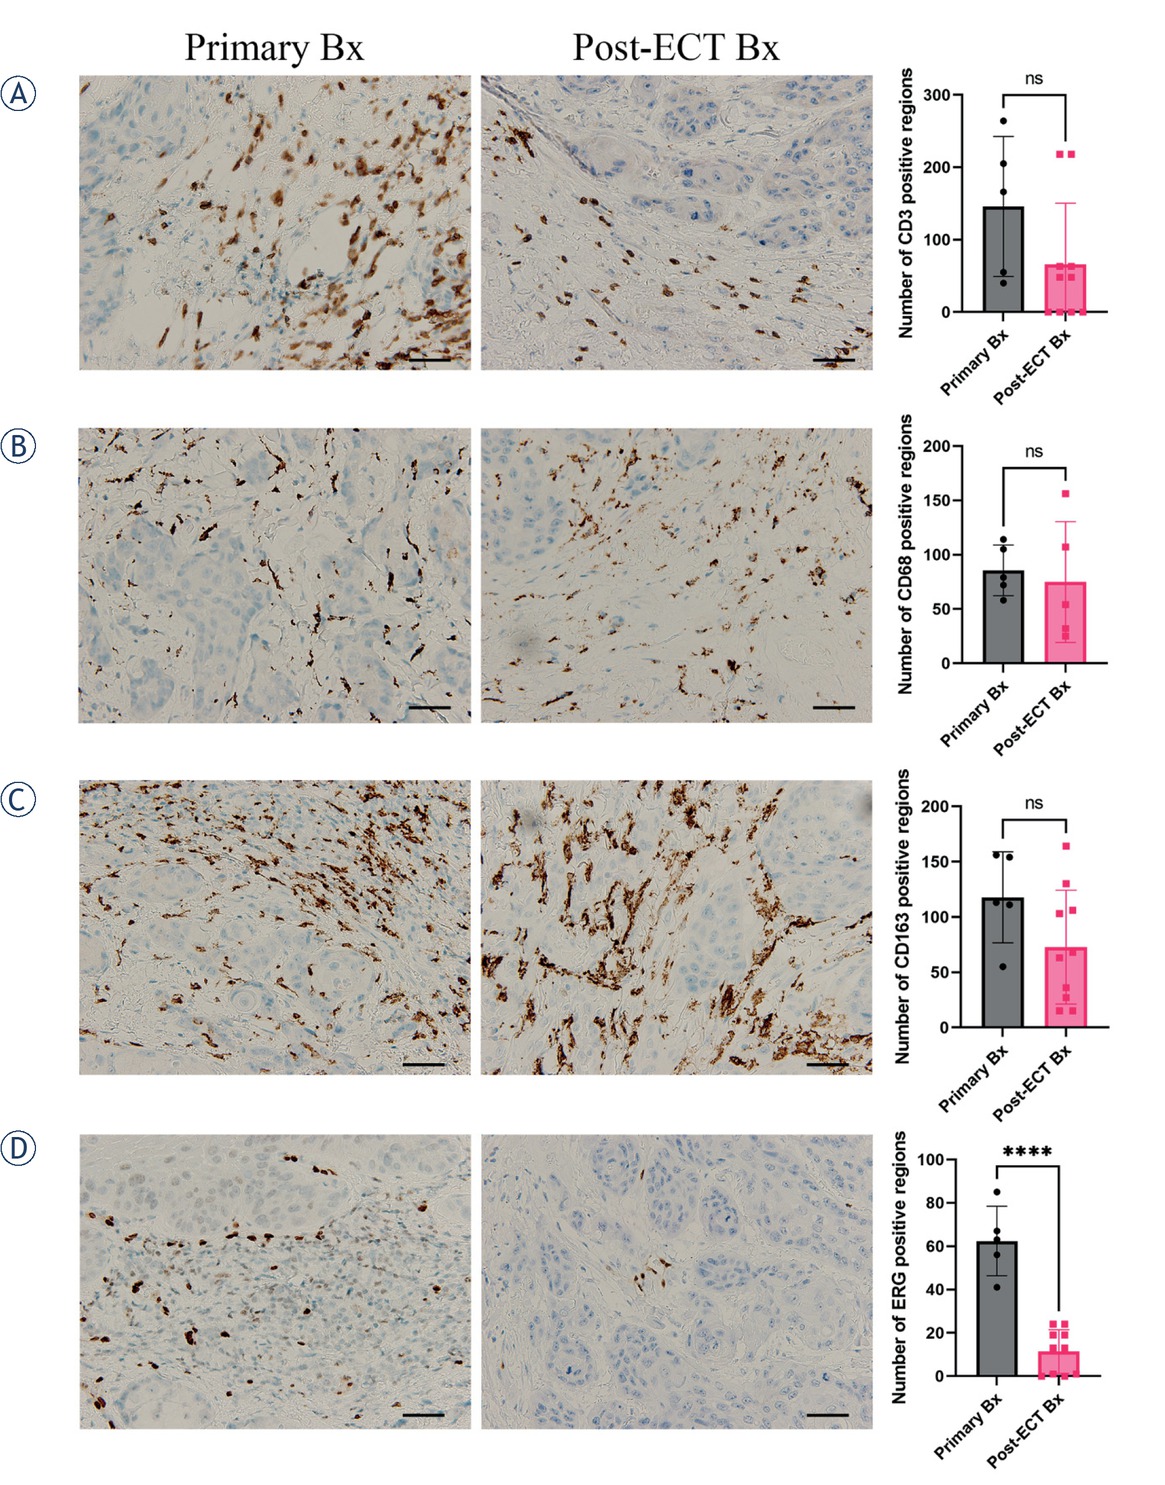
Figure 3
Immunohistologically stained sections for lymphocytes CD3 (A), macrophages CD68 PMG1 (B) and CD163 (C), and blood vessels ERG (D), from primary biopsy (Primary Bx) and post-electrochemotherapy biopsy (post-ECT Bx) samples. Scale bar represents 50 μm. The number of positively stained regions ± standard error of the mean (SEM) is presented.