
Figure 1
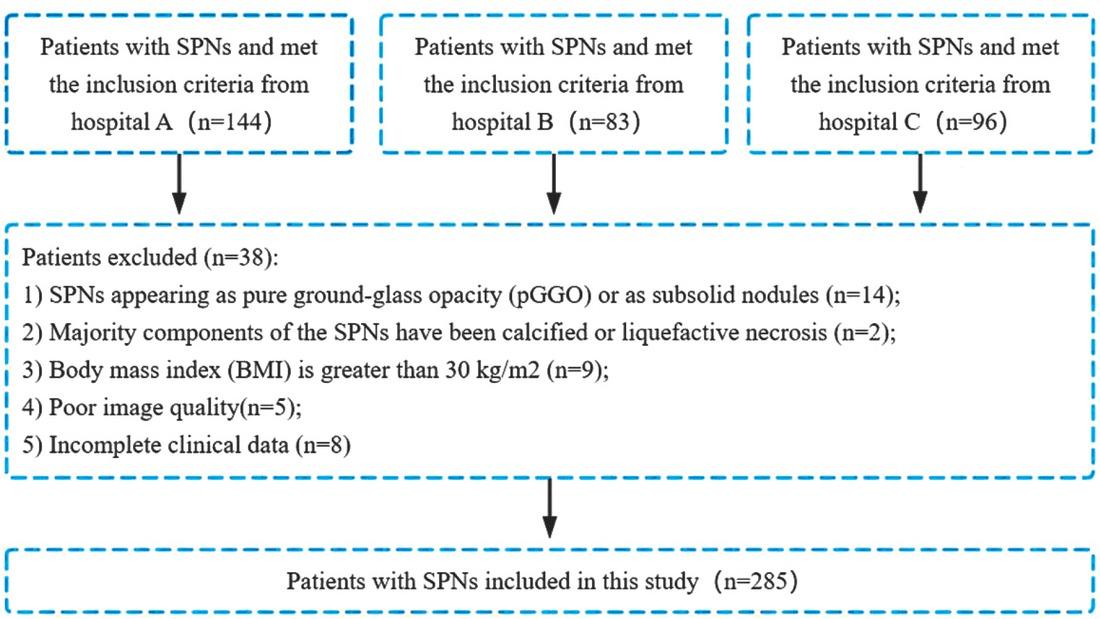
Figure 2
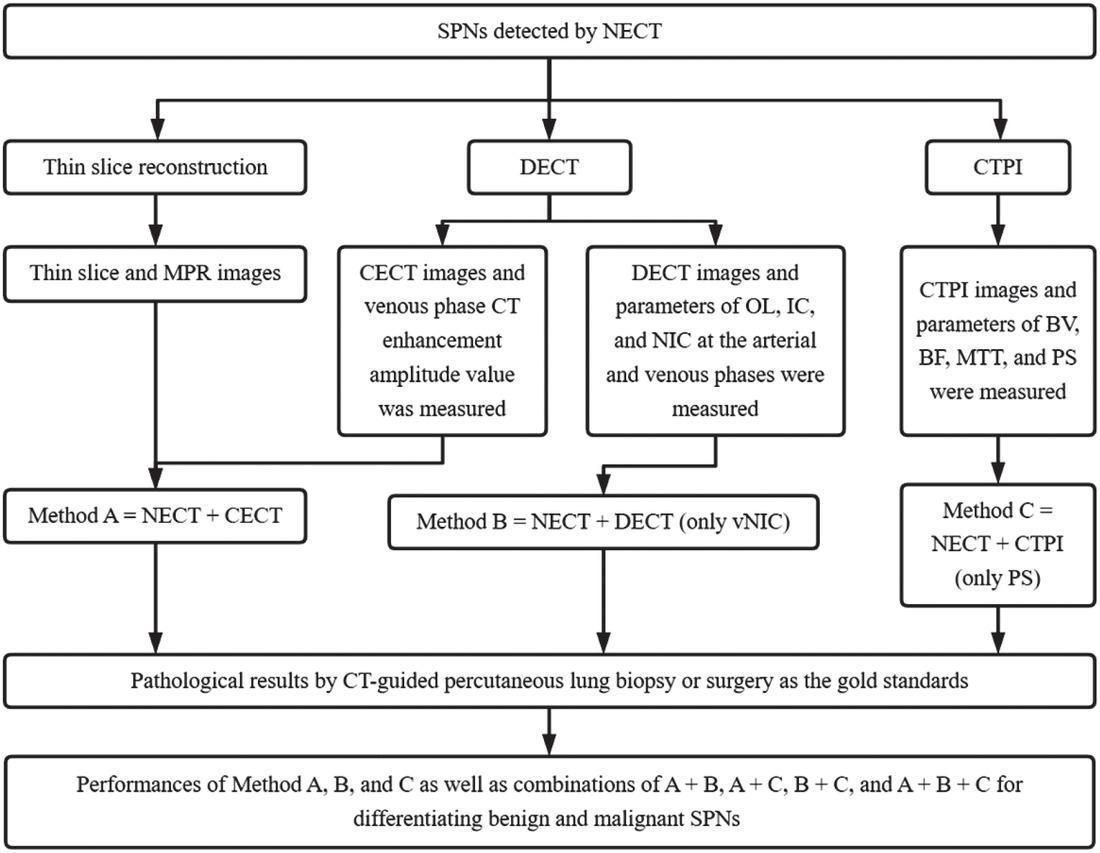
Figure 3
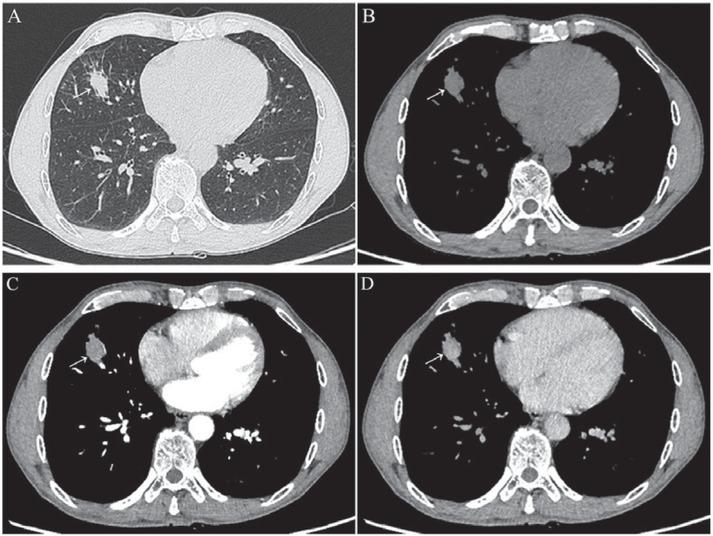
Figure 4
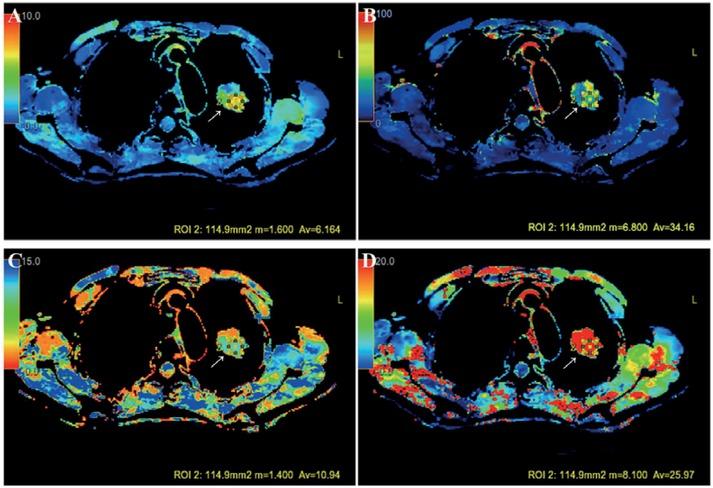
Figure 5
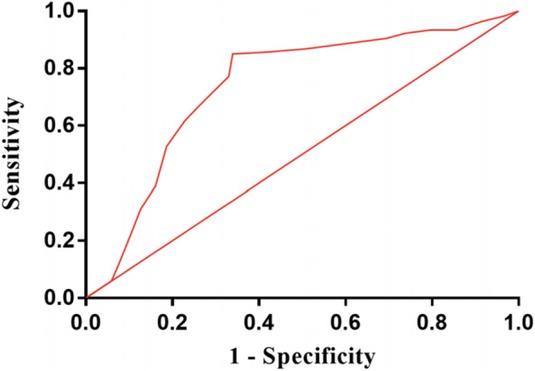
Figure 6
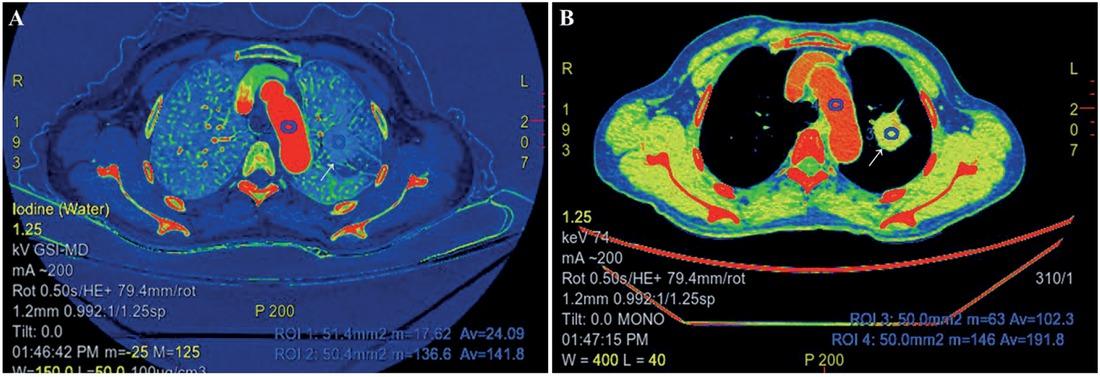
Figure 7
Solitary pulmonary nodules evaluated with CT perfusion imaging
| Parameters* | Benign SPNs (n = 118) | Malignant SPNs (n = 167) | P values |
|---|---|---|---|
| BF (ml/100 g/min) | 49.34 (27.78, 72.81) | 58.44 (24.91, 80.47) | 0.1022 |
| BV (ml/100 g) | 4.79 (2.87, 7.66) | 4.84 (2.90, 7.74) | 0.1829 |
| MTT (s) | 6.71 (3.05, 9.58) | 7.66 (3.83, 10.54) | 0.2034 |
| PS (ml/100 g/min) | 8.89 (4.94, 12.45) | 14.37 (11.50, 16.29) | < 0.0001 |
Solitary pulmonary nodules evaluated with dual-energy CT
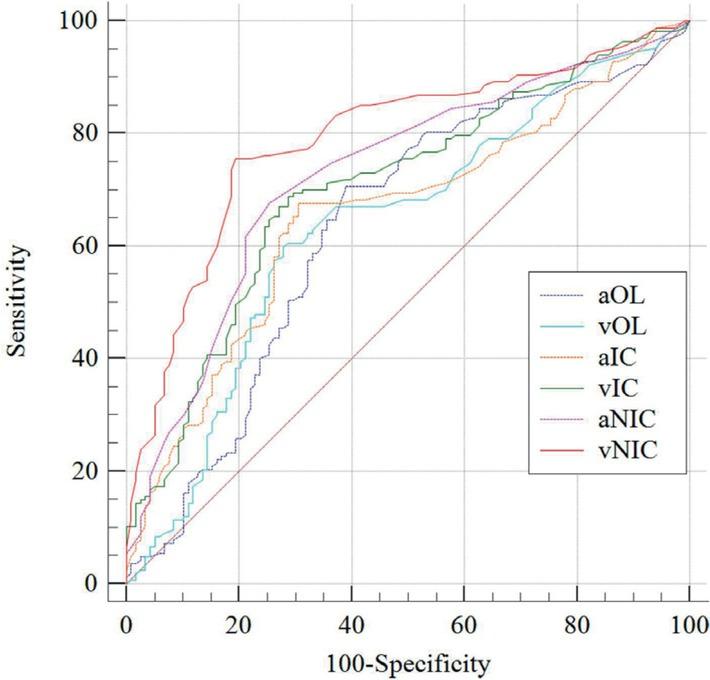
| Parameters | AUC | Threshold | Sensitivity | Specificity | 95% CI | P values |
|---|---|---|---|---|---|---|
| aOL (HU) | 0.636 | 13.89 | 70.66 | 61.02 | 0.577–0.692 | < 0.001 |
| vOL (HU) | 0.638 | 12.79 | 59.88 | 72.03 | 0.580–0.694 | < 0.001 |
| aIC (mg/ml) | 0.657 | 0.65 | 67.66 | 69.49 | 0.599–0.712 | < 0.001 |
| vIC (mg/ml) | 0.703 | 0.85 | 68.86 | 71.19 | 0.646–0.755 | < 0.001 |
| aNIC | 0.728 | 0.12 | 67.66 | 74.58 | 0.672–0.778 | < 0.001 |
| vNIC | 0.790 | 0.35 | 75.45 | 80.51 | 0.738–0.836 | 0.0001 |
Step-wise approach of multimodality CT imaging for evaluating solitary pulmonary nodules14647
| 1. Solid | ||
| Density | 2. Subsolid | |
| 3. Round or oval | ||
| Shape | 4. Triangular or polygonal | |
| 5. Smooth | ||
| Margins | 6. Lobulated | |
| 7. Spiculated | ||
| Non-contrast enhanced CT | 8. Fat | |
| Internal characteristics | 9. Calcification | |
| 10. Cavitation | ||
| 11. Pleural retraction | ||
| 12. Air bronchogram | ||
| Some complex findings | 13. Bubble like lucencies (pseudocavitation) | |
| 14. Cystic airspace | ||
| 15. Vascular convergence | ||
| Contrast enhanced CT | Parameter (s) | 16. Degree of enhancement |
| CT perfusion imaging | Parameter (s) | 17. Permeability surface |
| Dual-energy CT | Parameter (s) | 18. Normalized iodine concentration at the venous phase |
Solitary pulmonary nodules (SPNs) evaluated with dual-energy CT
| Parameters* | Benign SPNs (n = 118) | Malignant SPNs (n = 167) | P Values |
|---|---|---|---|
| aOL (HU) | 13.24 (10.97, 21.58) | 19.58 (13.29, 26.07) | < 0.0001 |
| vOL (HU) | 11.09 (10.09, 14.86) | 14.99 (10.59, 23.98) | < 0.0001 |
| aIC (mg/ml) | 0.69 (0.47, 0.985) | 1.13 (0.70, 1.56) | < 0.0001 |
| vIC (mg/ml) | 0.55 (0.44, 1.00) | 0.97 (0.50, 1.46) | < 0.0001 |
| aNIC | 0.10 (0.06, 0.13) | 0.18 (0.11, 0.25) | < 0.0001 |
| vNIC | 0.23 (0.13, 0.32) | 0.54 (0.43, 0.65) | < 0.0001 |
Pathological results of the 285 solitary pulmonary nodules (SPNs) included in this study
| SPNs | Pathology | Datum (%) |
|---|---|---|
| Benign SPNs (n = 118) | ||
| Tuberculosis | 46 (29.0%) | |
| Acute and chronic inflammation | 32 (27.1%) | |
| Inflammatory pseudotumor | 14 (11.9%) | |
| Hamartoma | 9 (7.6%) | |
| Pulmonary sclerosing hemangioma | 6 (5.1%) | |
| Sequestration | 4 (3.4%) | |
| Bronchogenic cyst | 3 (2.5%) | |
| Rheumatoid arthritis | 2 (1.7%) | |
| Granulomatosis with polyangiitis | 2 (1.7%) | |
| Malignant SPNs (n = 167) | ||
| Primary pulmonary carcinoma | 116 (69.5%) | |
| Solitary metastasis | 23 (13.8%) | |
| Primary lung neuroendocrine tumor | 21 (12.6%) | |
| Primary pulmonary lymphoma | 7 (4.2%) |
Solitary pulmonary nodules evaluated with multimodality CT imaging
| Methods* | Sensitivity (%) | Specificity (%) | Accuracy (%) | PPV (%) | NPV (%) |
|---|---|---|---|---|---|
| Method A | 83.23 | 63.56 | 75.09 | 76.37 | 72.82 % |
| Method B | 85.63 | 67.80 | 78.25 | 79.01 | 76.92 % |
| Method C | 84.43 | 66.10 | 76.84 | 77.90 | 75.00 % |
| Method A+B | 94.61 | 74.58 | 86.32 | 84.04 | 90.72 % |
| Method A+C | 92.81 | 77.97 | 86.67 | 85.64 | 88.46 % |
| Method B+C | 95.81 | 81.36 | 89.82 | 87.91 | 93.20 % |
| Method A+B+C | 97.60 | 88.14 | 93.68 | 92.09 | 96.30 % |
Pairwise comparison of AUC of dual energy CT parameters in 285 patients with solitary pulmonary nodules
| Parameters* | Z statistic | P value |
|---|---|---|
| aOL vs vOL | 0.0995 | 0.9207 |
| aOL vs aIC | 0.813 | 0.4162 |
| aOL vs vIC | 2.485 | 0.0129 |
| aOL vs aNIC | 3.171 | 0.0015 |
| aOL vs vNIC | 5.170 | < 0.0001 |
| vOL vs aIC | 0.702 | 0.4829 |
| vOL vs vIC | 2.567 | 0.0103 |
| vOL vs aNIC | 3.280 | 0.0010 |
| vOL vs vNIC | 5.345 | < 0.0001 |
| aIC vs vIC | 2.034 | 0.0420 |
| aIC vs aNIC | 2.755 | 0.0059 |
| aIC vs vNIC | 4.728 | < 0.0001 |
| vIC vs aNIC | 1.036 | 0.3001 |
| vIC vs vNIC | 3.227 | 0.0013 |
| aNIC vs vNIC | 2.708 | 0.0068 |
Patient characteristics in 285 patients with solitary pulmonary nodules
| Characteristics | Pathology | P value | |
|---|---|---|---|
| Benign SPNs (n = 118) | Malignant SPNs (n = 167) | ||
| Gender* | |||
| Male | 56 (47.46%) | 96 (57.49%) | |
| Female | 62 (52.54%) | 71 (42.51%) | 0.1170 |
| Age (years)# | 50.84 ± 19.60 | 52.93 ± 20.30 | 0.3952 |
| Smoking status* | |||
| Yes | 52 (44.07%) | 81 (48.50%) | |
| No | 66 (55.93%) | 86 (51.50%) | 0.4721 |
| Tumor history* | |||
| Yes | 17 (14.41%) | 28 (16.77%) | |
| No | 101 (85.59%) | 139 (83.23%) | 0.6245 |
| Tumor biomarkers* | |||
| Normal | 103 (87.29%) | 139 (83.23%) | 0.4026 |
| Abnormal | 15 (12.71%) | 28 (16.77%) | |
Non-enhanced computed tomography (NECT) in evaluating solitary pulmonary nodules (SPNs) with various categories in 285 patients
| Items | Category I | Category II | Category III | Category IV | Category V |
|---|---|---|---|---|---|
| Benign SPNs (n = 118) | 39 | 9 | 48 | 22 | 0 |
| Malignant SPNs (n = 167) | 0 | 5 | 54 | 19 | 89 |
Solitary pulmonary nodules evaluated with non-contrast enhanced CT
| CT findings* | Benign SPNs (n = 118) | Malignant SPNs (n = 167) | P Values |
|---|---|---|---|
| Smooth margin | |||
| Yes | 84 (71.19%) | 49 (29.34%) | < 0.0001 |
| No | 34 (28.81%) | 118 (70.66%) | |
| Lobulated sign | |||
| Yes | 29 (24.58%) | 115 (68.86%) | |
| No | 89 (75.42%) | 52 (31.14%) | < 0.0001 |
| Spiculated sign | |||
| Yes | 25 (21.19%) | 108 (78.81%) | |
| No | 93 (64.67%) | 59 (35.33%) | < 0.0001 |
| Vacuole sign | |||
| Yes | 13 (11.02%) | 38 (22.75%) | 0.0120 |
| No | 105 (88.98%) | 129 (77.25%) | |
| Cavity sign | |||
| Yes | 9 (7.63%) | 16 (9.58%) | |
| No | 109 (92.37%) | 151 (90.42%) | 0.6727 |
| Air bronchogram | |||
| Yes | 33 (27.97%) | 56 (33.53%) | 0.3643 |
| No | 85 (72.03%) | 111 (66.47%) | |
| Calcification | |||
| Yes | 10 (8.47%) | 6 (3.59%) | |
| No | 108 (91.53%) | 161 (96.41%) | 0.1149 |
| Fat | |||
| Yes | 6 (5.08%) | 4 (2.40%) | 0.3277 |
| No | 112 (94.92%) | 163 (97.60%) | |
| Pleural indentation | |||
| Yes | 25 (21.19%) | 89 (53.29%) | < 0.0001 |
| No | 93 (78.81%) | 78 (46.71%) | |
| Vessel convergence | |||
| Yes | 33 (27.97%) | 84 (50.30%) | 0.0002 |
| No | 85 (72.03%) | 83 (49.70%) | |
| Adjacent bronchial changes | |||
| Yes | 26 (22.03%) | 43 (25.75%) | 0.4867 |
| No | 92 (77.97%) | 124 (74.25%) | |
| Location | |||
| Upper and middle lobes | 53 (44.92%) | 79 (47.31%) | 0.7186 |
| Inferior lobe | 65 (55.08%) | 88 (52.69%) | |
| Size (mm) | |||
| 15–20 | 29 (24.58%) | 46 (27.54%) | 0.5883 |
| 20–30 | 89 (75.42%) | 121 (72.46%) |