
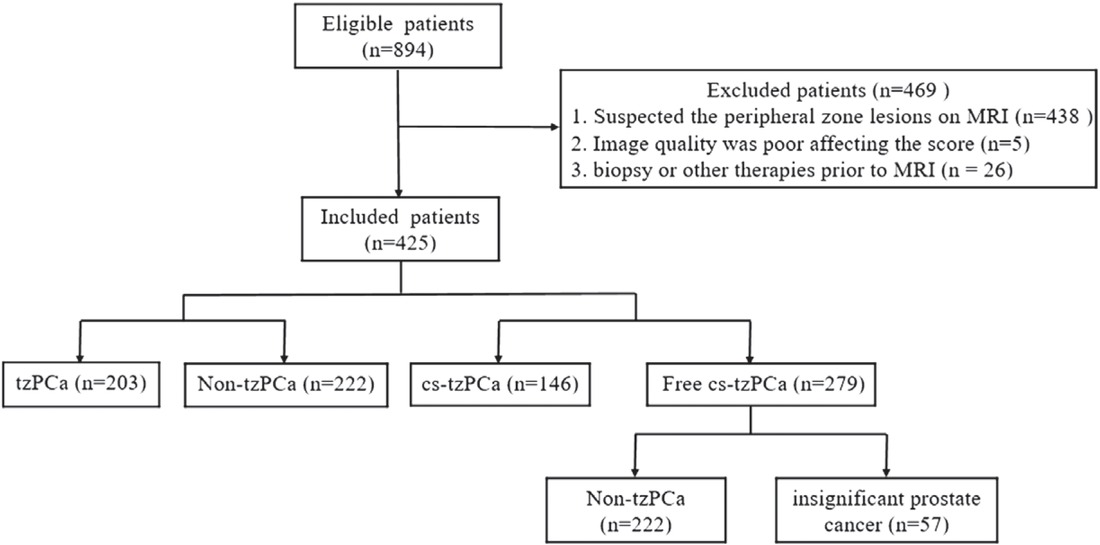
Figure 1
Flowchart showing the patient recruitment process.
Table 1
Sequence parameters for prostate MRI
| Parameters | T2WI | DWI | DCE |
|---|---|---|---|
| Sequence | FRFSE | SE-EPI | 3D-GRE |
| TR/TE (ms) | 4137/86 | 4200/90 | 4.3/1.3 |
| Flip angle | 110° | 90° | 12° |
| Echo train length | 32 | 1 | N/A |
| FOV (mm × mm) | 270 × 270 | 360 × 360 | 400 × 400 |
| Matrix size | 288 × 192 | 128 × 96 | 320 × 192 |
| Slice thickness (mm) | 3.0 | 3.0 | 3.0 |
| Other | b values = 0, 50, 100, 150, 200, 500, 800, 1000, 1500, 2000 sec/mm2 | Temporal resolution > 10s, total scan time of 5 min |
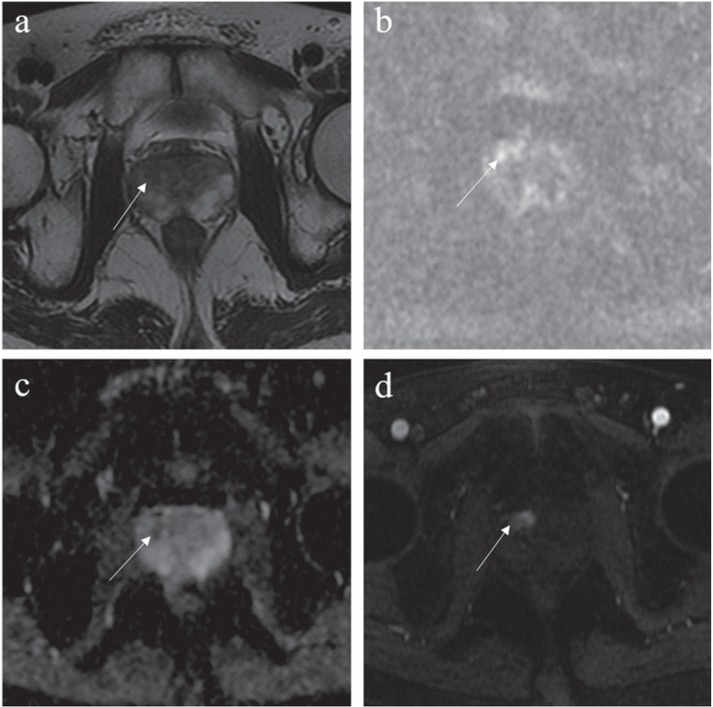
Figure 2
Images from a 62-year-old male patient with a total prostate-specific antigen (PSA) of 7.66 ng/mL. (A) Axial T2-weighted imaging (T2WI) showed focal hypointensity on the right lobe of the prostate in the transitional zone with a blurred margin and a T2WI score of 3. (B) Diffusion-weighted imaging (DWI) showed a slight increase in lesion signal. (C) Reduced corresponding apparent diffusion coefficient (ADC) value with a score of 3. (D) dynamic contrast-enhancement (DCE) showed obvious enhancement in the early stage of the lesion, thus indicating that the DCE score was positive. Scores were 3, 4, and 4 based on T2WI + DWI, T2WI + DCE, and T2WI + DWI + DCE, respectively. The lesion was confirmed to be clinically significant transitional-zone prostate cancer (cs-tzPCa) based on biopsy (Gleason score of 5 + 4).
Table 2
Scoring criteria of transition zone prostate for three sequence combinations
| T2WI | DWI | DCE | T2WI + DWI | T2WI | + DCE | T2WI + DWI + DCE |
|---|---|---|---|---|---|---|
| 1 | 1~5 | − | 1 | 1 | 1 | |
| 1 | 1~5 | + | 1 | 2 | 2 | |
| 2 | 1~3 | − | 2 | 2 | 2 | |
| 2 | 1~3 | + | 2 | 3 | 3 | |
| 2 | 4~5 | − | 3 | 2 | 3 | |
| 2 | 4~5 | + | 3 | 3 | 4 | |
| 3 | 1~4 | − | 3 | 3 | 3 | |
| 3 | 1~4 | + | 3 | 4 | 4 | |
| 3 | 5 | − | 4 | 3 | 4 | |
| 3 | 5 | + | 4 | 4 | 5 | |
| 4 | 1~5 | − | 4 | 4 | 4 | |
| 4 | 1~5 | + | 4 | 5 | 5 | |
| 5 | 1~5 | − | 5 | 5 | 5 | |
| 5 | 1~5 | + | 5 | 5 | 5 |
Table 3
Clinicopathological data of patients included in this study
| Clinicopathological data | Patients |
|---|---|
| Age (year), Mean ± SD | 66 ± 9.0 |
| T-PSA (ng/ml), Median (Upper and lower quartiles) | 9.4 (6.3 + 15.4) |
| tzPCa, n (%) | 203 (48%) |
| Non-tzPCa, n (%) | 222 (52%) |
| cs-tzPCa, n (%) | 146 (34%) |
| Free cs-tzPCa, n (%) | 279 (66%) |
| Tumor size (mm), Median (Upper and lower quartiles) | 12.7 (9.1 + 22.5) |
| GS, n (%) | |
| 3 + 3 | 57 (28%) |
| 3 + 4 | 56 (28%) |
| 4 + 3 | 24 (12%) |
| 3 + 5 | 3 (1.5%) |
| 4 + 4 | 18 (8.9%) |
| 4 + 5 | 28 (13.8%) |
| 5 + 3 | 1 (0.5%) |
| 5 + 4 | 13 (6.4%) |
| 5 + 5 | 3 (1.5%) |
Table 4
Comparison of diagnostic efficacy of three sequence combinations in tzPCa
| tzPCa (n =203) | Non-tzPCa (n=222) | Sensitivity (%) | Specificity (%) | PPV (%) | NPV(%) | Accuracy (%) | AUC (95% CI) | ||
|---|---|---|---|---|---|---|---|---|---|
| T2WI + DWI | ≥ 4 (n=191) > 4 (n=234) | 161 42 | 30 192 | 79.3 | 86.5 | 84.3 | 82.1 | 83.1 | 0.863 (0.827–0.894) |
| T2WI + DCE | ≥ 4 (n=243) > 4 (n=182) | 172 31 | 71 151 | 84.7 | 68.0 | 70.8 | 83.0 | 76.0 | 0.868 (0.832 + 0.899) |
| T2WI + DWI + DCE | ≥ 4 (n=244) > 4 (n=181) | 174 29 | 70 152 | 85.7 | 68.5 | 71.3 | 84.0 | 76.7 | 0.863 (0.827 + 0.895) |
| aP | 0.001 | > 0.001 | NA | NA | 0.002 | 0.424 | |||
| bP | > 0.001 | > 0.001 | NA | NA | > 0.001 | 0.968 | |||
| cP | 0.500 | 1.000 | NA | NA | 0.250 | 0.369 |
[i] AUC = area under curve; CI = confidence interval; DCE = dynamic contrast-enhancement; DWI = diffusion-weighted imaging; NPV = negative predictive value; PPV = positive predictive value; tzPCa = transitional-zone prostate cancer; T2WI = T2-weighted imaging
aP value between T2WI + DWI and T2WI + DCE; bP value between T2WI + DWI and T2WI + DWI + DCE; cP value between T2WI + DCE and T2WI + DWI + DCE
Table 5
Comparison of diagnostic efficacy of three sequence combinations in cs-tzPCa
| cs-tzPCa (n=146) | Free cs-tzPCa (n=279) | Sensitivity (%) | Specificity (%) | PPV (%) | NPV (%) | Accuracy (%) | AUC (95%CI) | ||
|---|---|---|---|---|---|---|---|---|---|
| T2WI + DWI | ≥ 4 (n=191) > 4 (n=234) | 121 25 | 70 209 | 82.9 | 74.9 | 63.4 | 89.3 | 77.6 | 0.840 (0.802–0.874) |
| T2WI + DCE | ≥ 4 (n=243) > 4 (n=182) | 129 17 | 114 165 | 88.4 | 59.1 | 53.1 | 90.7 | 69.2 | 0.833 (0.795–0.868) |
| T2WI + DWI + DCE | ≥ 4 (n=244) > 4 (n=181) | 131 15 | 113 166 | 89.7 | 59.5 | 53.7 | 91.7 | 69.9 | 0.824 (0.785–0.869) |
| aP | 0.008 | > 0.001 | NA | NA | > 0.001 | 0.430 | |||
| bP | 0.002 | > 0.001 | NA | NA | > 0.001 | 0.101 | |||
| cP | 0.500 | 1.000 | NA | NA | 0.250 | 0.193 |
[i] AUC = area under curve; CI = confidence interval; DCE = dynamic contrast-enhancement; DWI = diffusion-weighted imaging; NPV = negative predictive value; PPV = positive predictive value; tzPCa = transitional-zone prostate cancer; T2WI = T2-weighted imaging
aP value between T2WI + DWI and T2WI + DCE; bP value between T2WI + DWI and T2WI + DWI + DCE; cP value between T2WI + DCE and T2WI + DWI + DCE
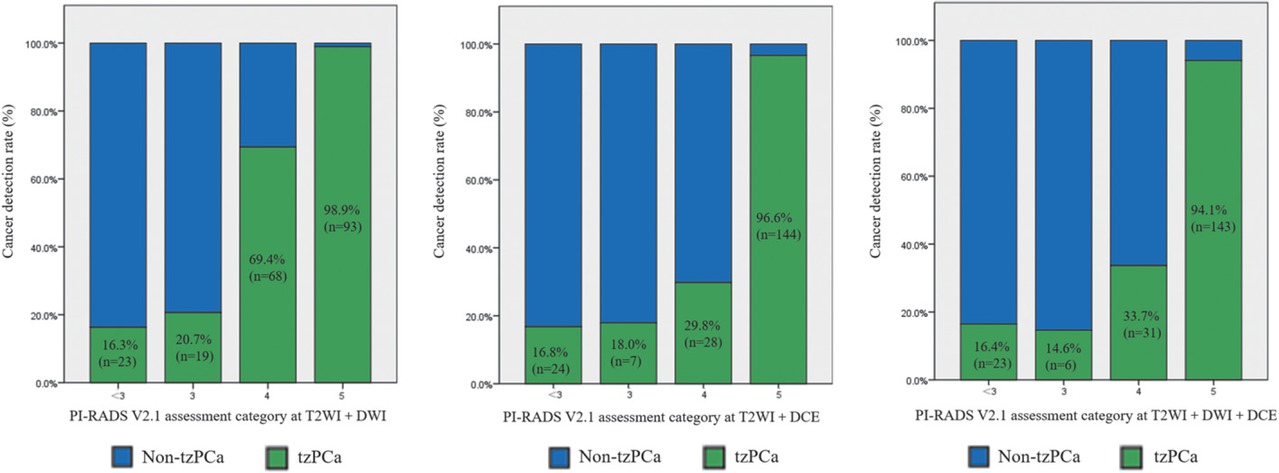
Figure 3
Histograms showing cancer detection rates of tzPCa based on the T2-weighted imaging (T2WI) + diffusion-weighted imaging (DWI), T2WI + dynamic contrast-enhancement (DCE), and T2WI + DWI + DCE.
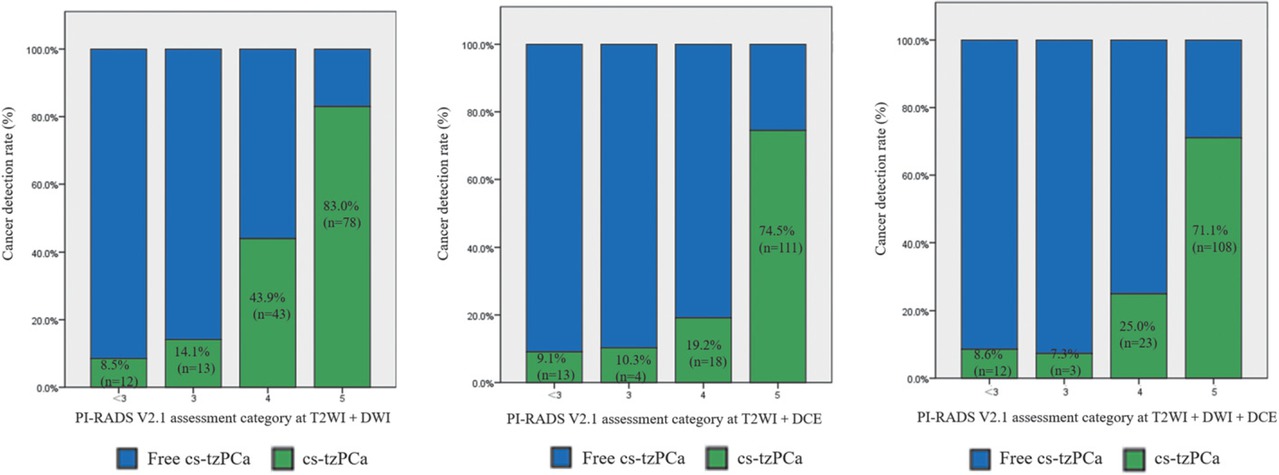
Figure 4
Histograms showing cancer detection rates of cs-tzPCa based on the T2-weighted imaging (T2WI) + diffusion-weighted imaging (DWI), T2WI + dynamic contrast-enhancement (DCE), and T2WI + DWI + DCE.