
Figure 1
Figure 2
Figure 3
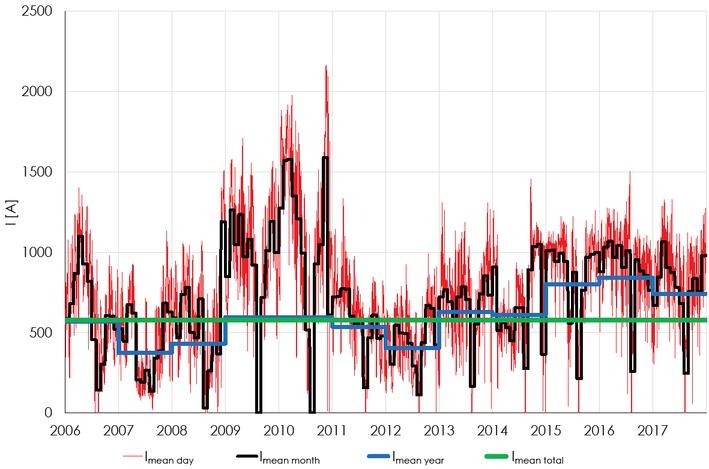
Figure 4
Comparison of the calculated and measured value of the extremely low frequency magnetic field for 400 kV power line with the highest mean load
| Location | 1 | 2 | 3 | 4 | 5 |
|---|---|---|---|---|---|
| Calculated value [μT] | 7.4 | 3.8 | 3.0 | 9.1 | 3.4 |
| Measured value [μT] | 7.3 | 3.4 | 4.1 | 12.3 | 2.7 |
The distances from the 400 kV power line with the highest mean load, at which the value of the extremely low frequency magnetic field falls below 0_1, 0_2, 0_3 and 0_4 μT, respectively
| Distance | B = 0.1 μT | B = 0.2 μT | B = 0.3 μT | B = 0.4 μT |
|---|---|---|---|---|
| Nominal load | 340 m | 238 m | 193 m | 167 m |
| Highest daily mean load (2164 A, 23. 11. 2010) | 303 m | 212 m | 172 m | 149 m |
| Highest weekly mean load (1987A, 22. – 28.11.2010) | 290 m | 203 m | 165 m | 143 m |
| Highest monthly mean load (1588 A, 11. 2010) | 258 m | 181 m | 147 m | 127 m |
| Highest yearly mean load (842A, 2016) | 187 m | 131 m | 107 m | 92 m |
| Total mean load (742 A, 1. 1. 2006 – 31. 12. 2017) | 175 m | 123 m | 99 m | 87 m |
The proportion of Slovenian population of children and adolescents in 2005–2016, observed and expected number of cancer cases, and standardized incidence ratio with 95% confidence interval for all cancers combined (age 0–14 years), leukemia (age 0–19 years) and brain tumors (age 0–29 years) are presented according to five categories of ELF MF exposure
| < 0.1 mT | 0.1–0.2 mT | 0.2–0.3 mT | 0.3–0.4 mT | ≥ 0.4 mT | |
|---|---|---|---|---|---|
| Population* (proportion) | 99.5 % | 0.2 % | 0.1 % | 0.1 % | 0.1 % |
| All cancers (age 0–14 years) | |||||
| Observed number of cases | 516 | 0 | 0 | 0 | 0 |
| Expected number of cases | 513.6 | 1.1 | 0.6 | 0.3 | 0.5 |
| Standardized (95% confidence incidence interval) ratio | 1.0 (0.9–1.1) | no cases | no cases | no cases | no cases |
| Leukemia (age 0–19 years) | |||||
| Observed number of cases | 194 | 1 | 0 | 0 | 0 |
| Expected number of cases | 194.1 | 0.4 | 0.2 | 0.1 | 0.2 |
| Standardized interval) incidence ratio (95% confidence | 1.0 (0.9–1.2) | 2.4 (0.1–13.3) | no cases | no cases | no cases |
| Brain tumors (age 0–29 years) | |||||
| Observed number of cases | 195 | 0 | 1 | 0 | 0 |
| Expected number of cases | 178.4 | 0.4 | 0.2 | 0.1 | 0.2 |
| Standardized interval) incidence ratio (95% confidence | 1.0 (0.9–1.2) | no cases | 4.6 (0.1–25.4) | no cases | no cases |