
TABLE 1.
Demographics and preoperative data
| No. of patients | 24 |
|---|---|
| Age (years) | 41 ± 11 |
| Weight (kg) | 81 ± 12 |
| Height (cm) | 176 ± 8 |
| Gender (M/F) | 18/6 |
| ASA (I/II/III) | 9/15/0 |
| First operation/reoperation | 22/2 |
| Tumour size (cm3) | 46 ± 27 |
| Tumour location (side): | |
| Insular (left/right) | 4/3 |
| Frontal Central-PMC (left/right) | 2/2 |
| Frontal-Broca area (left/right) | 6/1 |
| Temporo-frontal (left/right) | 3/0 |
| Temporal-Wernicke area (left/right) | 3/0 |
[i] The results are expressed as mean ± SD or number of patients.
[ii] ASA = American Society of Anaesthesiologist; F = female; M = male; PMC = primary motor cortex
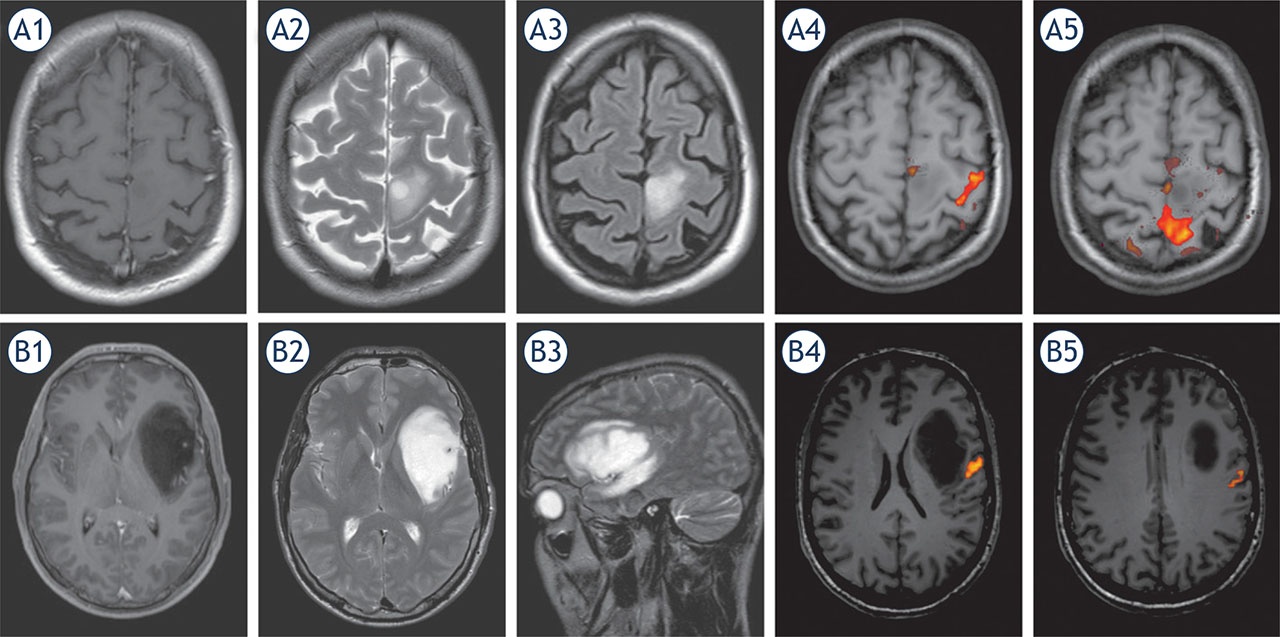
FIGURE 1.
Preoperative magnetic resonance images (MRI) of low-grade glioma located in primary motor cortex (A) and anaplastic astrocytoma located in anterior speech area (Broca area) (B). Preoperative imaging included T1 weighted contrast enhanced (A1, B1), T2 weighted (A2, B2), FLAIR (A3, B3) and functional magnetic resonance (fMRI); (A4, A5, B4, B5) images. The fMRI demonstrated the hand activation area (yellow/red colour) lateral (A4) and leg activation area behind (A5) the lesion in primary motor cortex. In second case fMRI demonstrated speech activation areas posterior to the lesion on the left side (B4, B5).
TABLE 2.
Intraoperative and early postoperative outcomes
| INTRAOPERATIVE DATA | |
|---|---|
| Duration of anaesthesia (minutes) | 278 ± 47 |
| Duration of procedure (minutes) | 215 ± 48 |
| Duration of testing (minutes) | 73 ± 26 |
| Comfort score (0- least; 10- most) | 8 ± 2 (5–10) |
| Pain score (0- no pain; 10- intolerable) | 4 ± 2 (0–5) |
| Cooperation score (0- poor; 10- excellent) | 10 ± 1 (9–10) |
| Complications (none/seizure/incomplete testing) | 13/8/3 |
| EARLY POSTOPERATIVE DATA | |
|---|---|
| Pain score after procedure (0- no pain; 10- intolerable) | 2 ± 1 (0–3) |
| Pain score ICU (0- no pain; 10- intolerable) | 2 ± 1 (0–3) |
| Level of effort (0- least; 10- most difficult) | 3 ± 2 (0–6) |
| Non-neurological complications | |
| Wound infection | 1 |
| Pulmonary embolism | 1 |
| Nausea | 2 |
| Pain | 2 |
| Neurological complications | |
| Walking disability | 1 |
| POCD and dysphasia | 1 |
| Mild hemiparesis, POCD, seizures | 1 |
| Tumour histology | |
| LGG | 14 |
| AA | 7 |
| GBM | 3 |
| Extent of resection | |
| LGG (GTR/STR/BR) | 4/7/3 |
| AA or GBM (GTR/NTR/STR) | 6/3/1 |
| Length of stay (days) | 6 ± 5 |
[i] The results are expressed as mean ± SD (range in brackets) or number of patients.
[ii] AA = anaplastic astrocytoma; BR = biopsy resection; GBM = glioblastoma; GTR = gross total resection; ICU = intensive care unit; LGG = low grade glioma; NTR = near total resection; POCD = postoperative cognitive decline; STR = subtotal resection
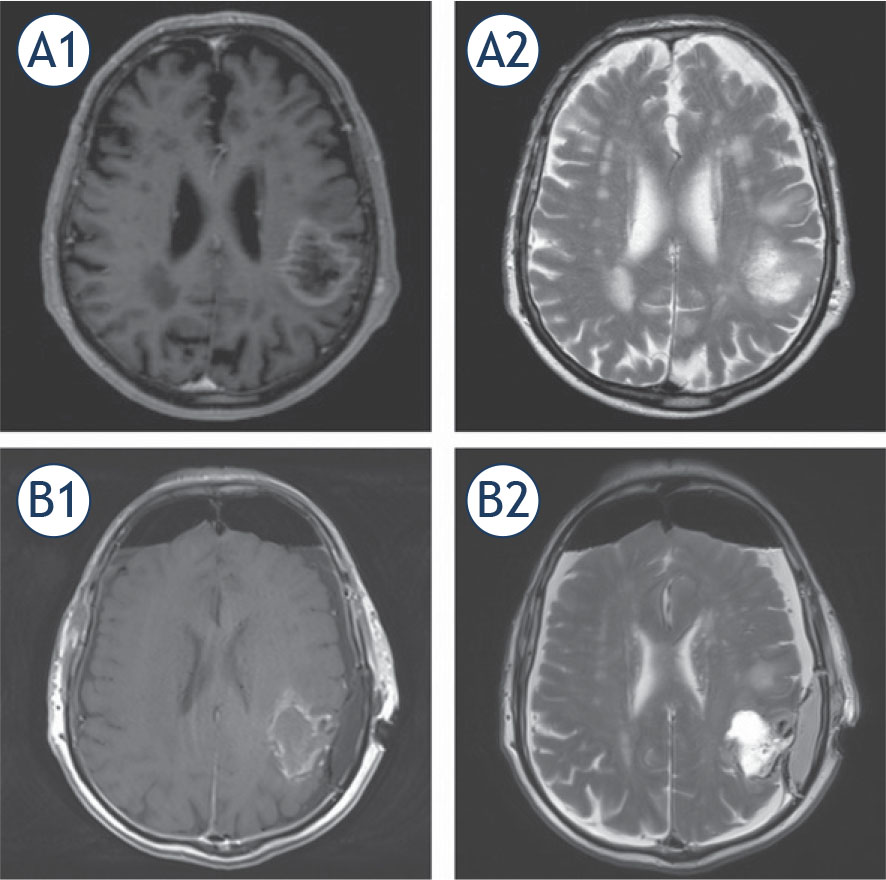
FIGURE 2.
Preoperative (A) and postoperative (B) T1 weighted contrast enhanced (A1, B1) and T2 weighted (A2, B2) magnetic resonance images (MRI) of glioblastoma located in supramarginal gyrus near Wernicke area. Preoperative images (A) demonstrate rim enhancing central necrotic oval lesion surrounded by oedema. Postoperative images (B) demonstrate post-resection cavity filled with partially haemorrhagic fluid and mild irregular contrast enhancing of resection edge – i.e. near total resection.
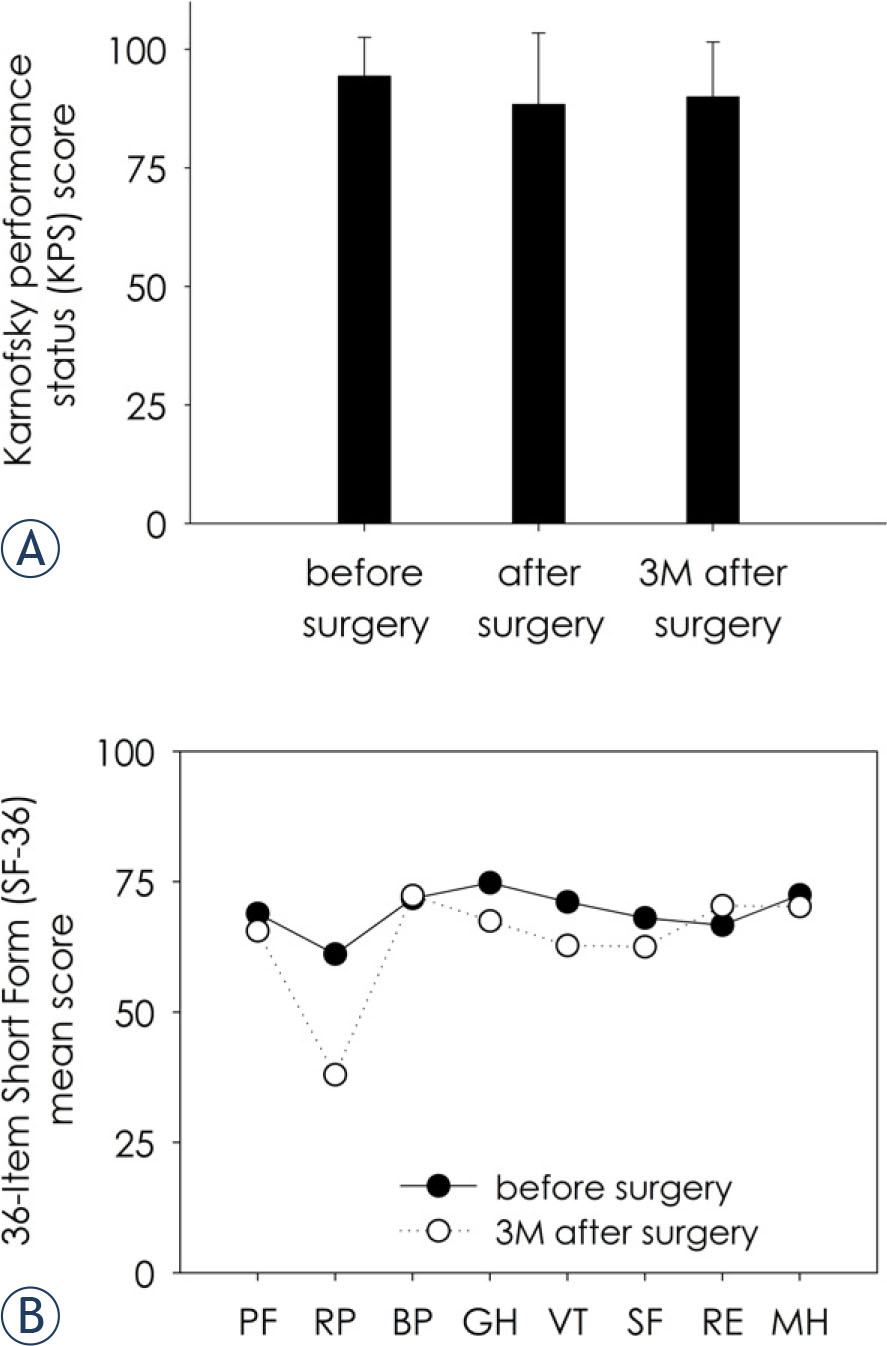
FIGURE 3.
The Karnowski Performance Scale (KPS) scores (A) and 36-Item Short Form (SF-36) health survey subscale scores (B) before surgery, after surgery and 3 months after surgery. The differences between the KPS scores and SF-36 subscale scores before and after surgery were not statistically significantly different (p > 0.05; n = 24 for KPS; n = 12 for SF-36).
BP = bodily pain; GH = general health; PF = physical function; MH = mental health; RE = role limitations due to emotional problems; RP – role limitations due to physical problems; SF = social functioning; VT = vitality; 3M = three months