
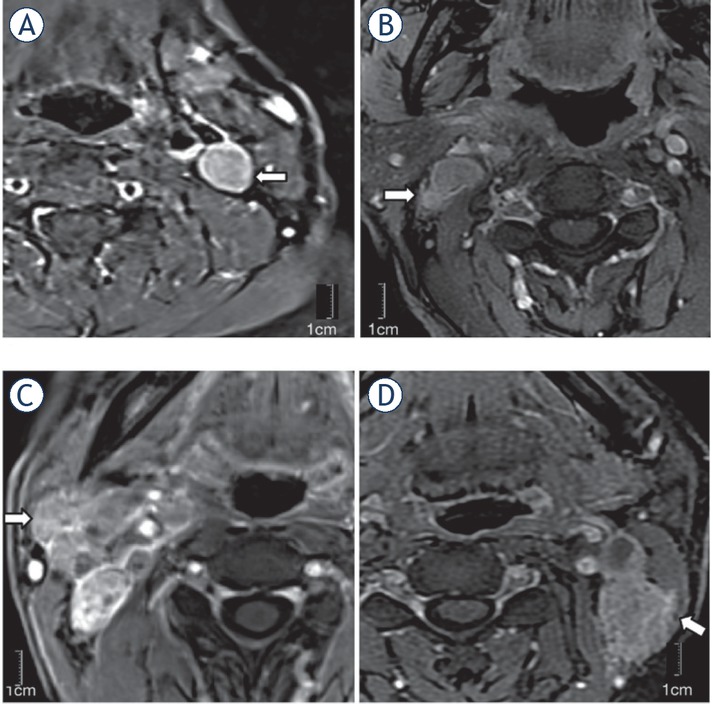
Figure 1
Axial T1-weighted fat-suppressed contrast MRI images of grade 0–2 extranodal extension (ENE) in four stage II nasopharyngeal carcinoma patients. (A) Grade 0: without ENE; (B) Grade 1: lymph node (LN) infiltrating surrounding fat; (C) Grade 2: matted LNs; and (D) Grade 3: LN infiltrating sternocleidomastoid muscle (wight arrows).
Table 1
Characteristics of 242 patients with stage II nasopharyngeal carcinoma
| Characteristics | No. (%) |
|---|---|
| Age, median (range) | 50 (18–76) |
| < 50 | 120 (49.6) |
| ≥ 50 | 122 (50.4) |
| Sex | |
| Male | 173 (71.5) |
| Female | 69 (28.5) |
| AJCC 8th T stage | |
| T1 | 104 (43.0) |
| T2 | 138 (57.0) |
| AJCC 8th N stage | |
| N0 | 30 (12.4) |
| N1 | 212 (87.6) |
| AJCC 8th subgroup | |
| T1N1M0 | 104 (43.0) |
| T2N0M0 | 31 (12.8) |
| T2N1M0 | 107 (44.2) |
| GTVnx volume (cm3), median (range) | 19.1 (2.1–74.0) |
| < 13.7 | 70 (28.9) |
| ≥ 13.7 | 172 (71.1) |
| GTVnd volume (cm3), median (range) | 8.7 (0–71.0) |
| < 29.1 | 212 (87.6) |
| ≥ 29.1 | 30 (12.4) |
| Lateral of RPLNs | |
| None | 90 (37.2) |
| Unilateral | 113 (46.7) |
| Bilateral | 39 (16.1) |
| LN located in level III | |
| Yes | 195 (80.6) |
| No | 47 (19.4) |
| LN size (cm) | 1.7 (0–6.0) |
| MAD < 2.2 | 152 (62.8) |
| MAD ≥ 2.2 | 90 (37.2) |
| Number of positive LN | 2 (0– 9) |
| 0 | 30 (12.4) |
| 1 | 69 (28.5) |
| 2 | 60 (24.8) |
| 3 | 51 (21.1) |
| 4 | 19 (7.9) |
| ≥ 5 | 13 (5.4) |
| †ENE grade | |
| Grade 0 | 153 (63.2) |
| Grade 1,2 | 52 (21.5) |
| Grade 3 | 37 (15.3) |
| CNN | |
| No | 179 (74.0) |
| Yes | 63 (26.0) |
| Treatment | |
| IMRT | 158 (65.3) |
| CCRT | 84 (34.7) |
[i] † ENE Grade 0 = none; Grade 1 = LN Infiltrating surrounding fat; Grade 2 = matted nodes; and Grade 3 = LN infiltrating adjacent muscle and (or) vessels and(or) skin
AJCC = American Joint Committee on Cancer staging system; CCRT = concurrent chemoradiotherapy; CNN = central nodal necrosis; ENE = extranodal extension; GTVnx/GTVnd = gross target volume of nasopharyngeal tumor/lymph nodes; IMRT = intensity-modulated radiotherapy; LN = lymph node; MAD = maximum diameter; RPLN = retropharyngeal lymph node
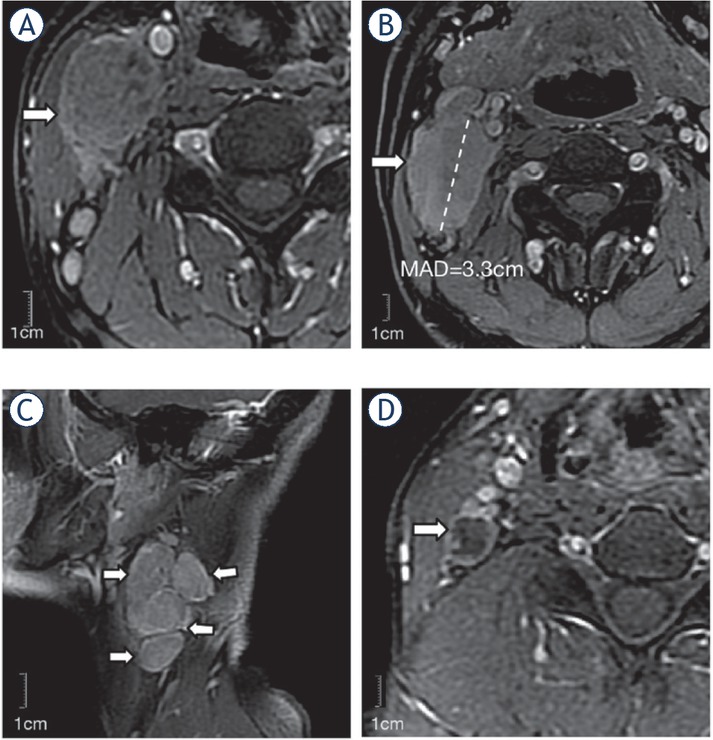
Figure 2
Multidimensional nodal features of stage II nasopharyngeal carcinoma significantly associated with survival outcomes in univariate or multivariate analysis. Axial T2-weighted fat-suppressed image of (A) a 24-year-old man with one lymph nodes (LN) in level III; (B) a 56-year-old man with maximum diameter of lymph node 3.3cm; (C) a 50-year-old woman with four metastatic LNs; and (D) Sagittal T1-weighted fat-suppressed contrast images of a 45-year-old woman showing central nodal necrosis (CNN) (wight arrows).
MAD = maximal axial diameter
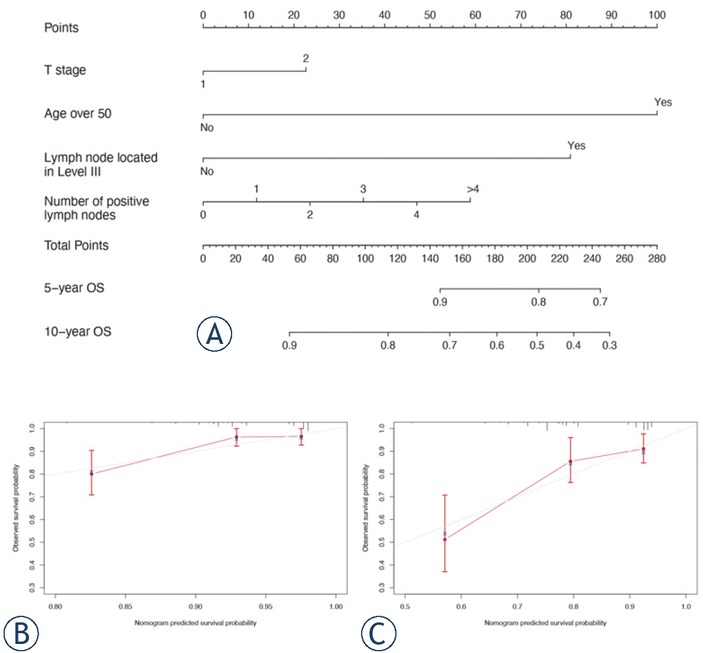
Figure 3
Nomogram and calibration plots of 5- and 10-year overall survival (OS). Number of positive lymph nodes was as continuous variable.
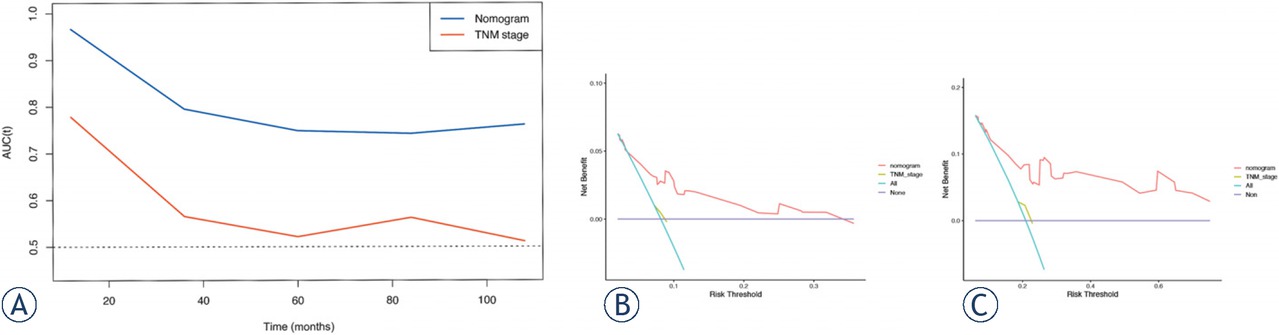
Figure 4
Comparison of (A) area under the curve (AUC) plots, decision curves of (B) 5-year overall survival (OS) and (C) 10-year OS between the nomogram and TNM stage.
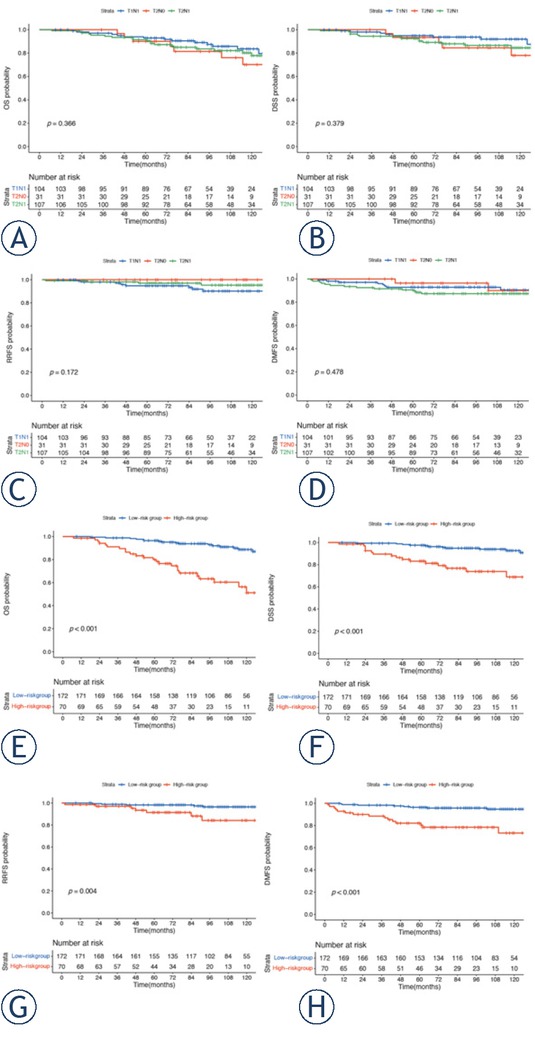
Figure 5
Survival curves of the (A–D) three subgroups in American Joint Committee on Cancer staging system (AJCC), TNM staging and (E–H) the low- and high-risk groups stratified by the nomogram-derived score.
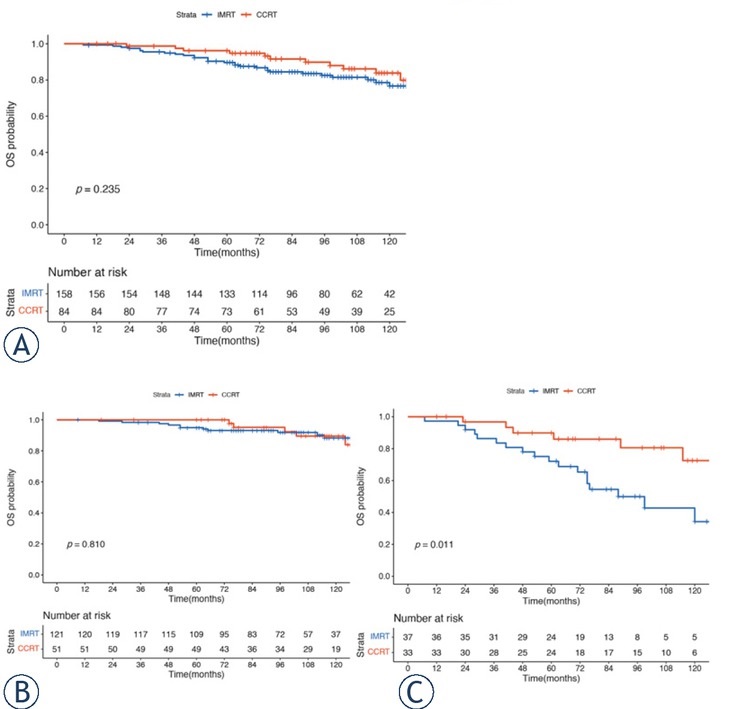
Figure 6
Impact of concurrent
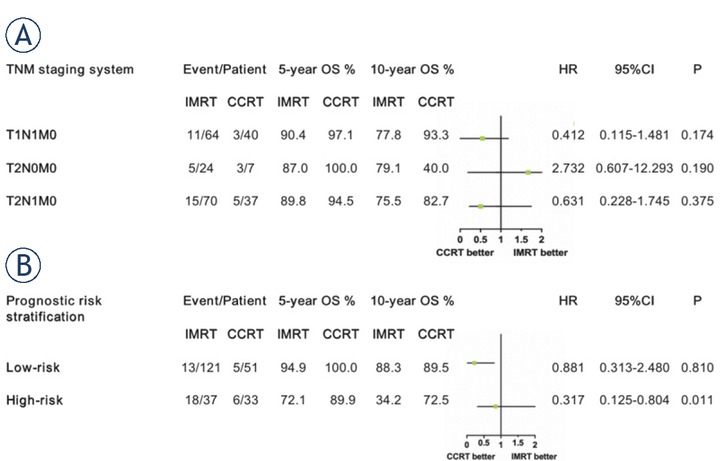
Figure 7
The 5-year and 10-year overall survival (OS) rates and hazard ratio (HR) between intensity-modulated radiotherapy (IMRT) group and concurrent chemoradiotherapy (CCRT) group according to (A) TNM staging system and (B) prognostic risk model.