
Figure 1
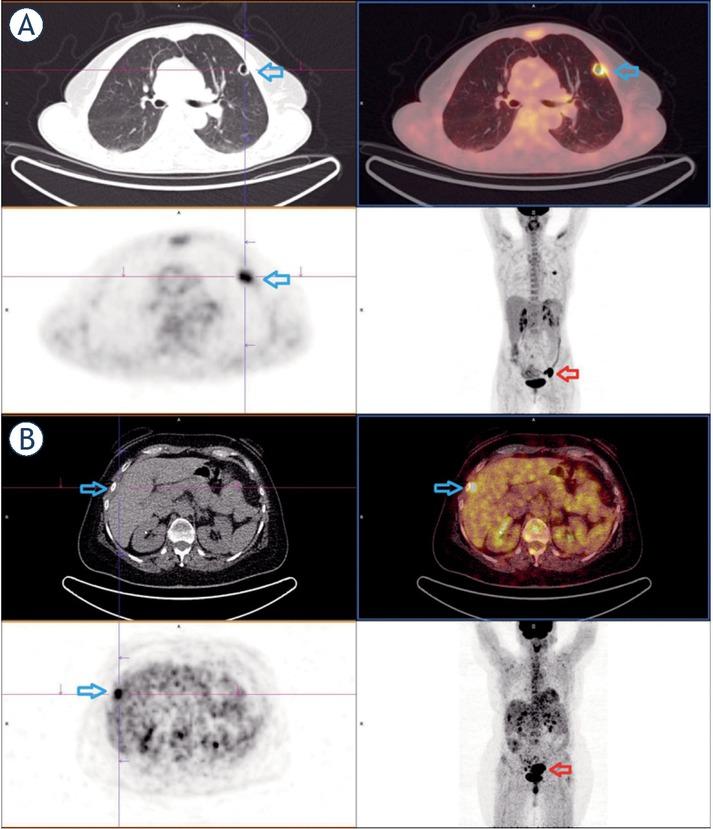
Figure 2
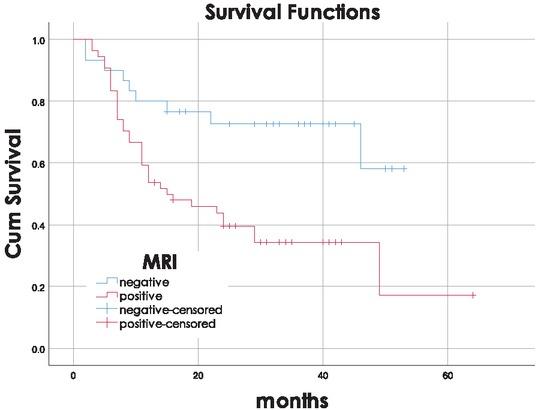
Figure 3
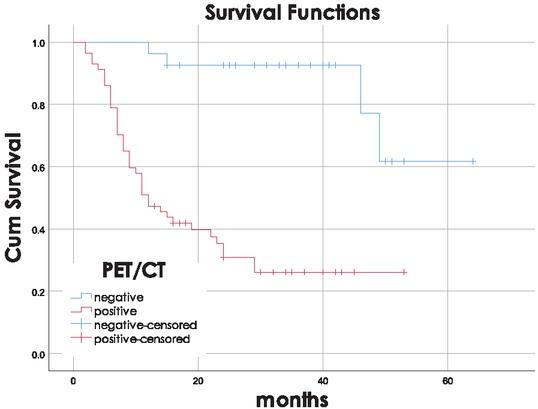
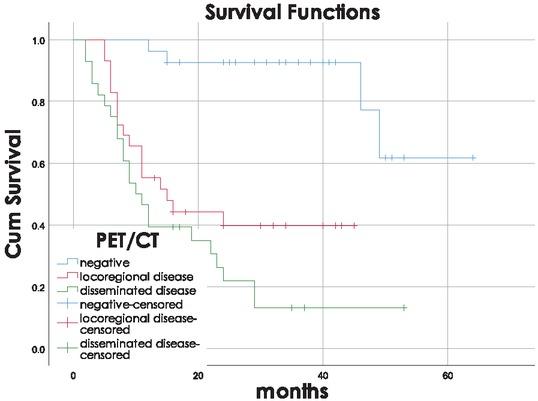
Figure 4
Multivariate Cox regression analysis of possible progression-free survival predictors in suspected recurrent cervical cancer (n = 84)
| Predictor | HR (95% confidence interval) | p value |
|---|---|---|
| Age | 0.995 (0.966–1.024) | 0.727 |
| Initial stage (IB/IIA vs. IIB/III/IV) | 1.605 (0.520–4.957) | 0.411 |
| Histological type (squamocellular vs. other) | 0.892 (0.419–1.898) | 0.766 |
| MRI (positive vs. negative) | 1.959 (0.888–4.323) | 0.096 |
| PET-CT (positive vs. negative) | 8.787 26.834(2.877) – | < 0.001* |
Univariate Cox regression analysis of possible progression-free survival predictors in suspected recurrent cervical cancer (n = 84)
| Predictor | HR (95% confidence interval) | p value |
|---|---|---|
| Age | 1.013 (0.987–1.040) | 0.336 |
| Initial stage (IB/IIA vs. IIB/III/IV) | 2.024 (0.753–5.962) | 0.155 |
| Histological type (squamocellular vs. other) | 1.245 (0.597–2.598) | 0.558 |
| Histological grade (1/2 vs. 3)* | 0.831 (0.448–1.905) | 0.831 |
| MRI (positive vs. negative) | 2.873 (1.370–6.027) | 0.005† |
| PET-CT (positive vs. negative) | 9.491 (3.302–27.274) | < 0.001† |
Patients’ characteristics
| Characteristic | Value |
|---|---|
| Age (years) | |
| Mean ± sd | 53 ± 11 |
| Initial FIGO disease stage, n (%) | |
| IB | 9 (11%) |
| IIA | 2 (2%) |
| IIB | 38 (45%) |
| III | 26 (31%) |
| IV | 9 (11%) |
| Tumor histological type, n (%) | |
| Squamous cell | 70 (83%) |
| Adenocarcinoma | 11 (14%) |
| Adenosquamous | 2 (2%) |
| Small cell | 1 (1%) |
| Tumor grade, n (%) | |
| Low grade | 6 (7%) |
| Intermediate grade | 50 (60%) |
| High grade | 10 (12%) |
| Unknown | 18 (21%) |
| Previous treatment, n (%) | |
| Surgery with (chemo)radiotherapy | 11 (13%) |
| Radiotherapy only | 10 (12%) |
| Radiotherapy with concurrent chemotherapy | 49 (58%) |
| Primary (chemo)radiation with salvage hysterectomy | 14 (17%) |
| MRI findings, n (%) | |
| Positive | 54 (64%) |
| Negative | 30 (36%) |
| PET-CT findings, n (%) | |
| Positive | 57 (68%) |
| Negative | 27 (32%) |
Diagnostic performance of MRI and PET-CT
| TP(n) | TN(n) | FP(n) | FN(n) | Sensitivity (%) | Specificity (%) | Accuracy (%) | |
|---|---|---|---|---|---|---|---|
| MRI | 34 | 22 | 20 | 8 | 80.1% | 52.4% | 66.7% |
| PET-CT | 41 | 26 | 16 | 1 | 97.6% | 61.9% | 79.8% |