![Detection and localization of hyperfunctioning parathyroid glands on [18F]fluorocholine PET/ CT using deep learning – model performance and comparison to human experts Cover](https://sciendo-parsed.s3.eu-central-1.amazonaws.com/647356604e662f30ba53ab53/cover-image.jpg)
Figure 1
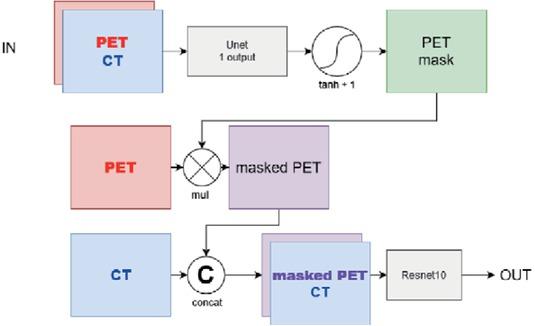
Figure 2
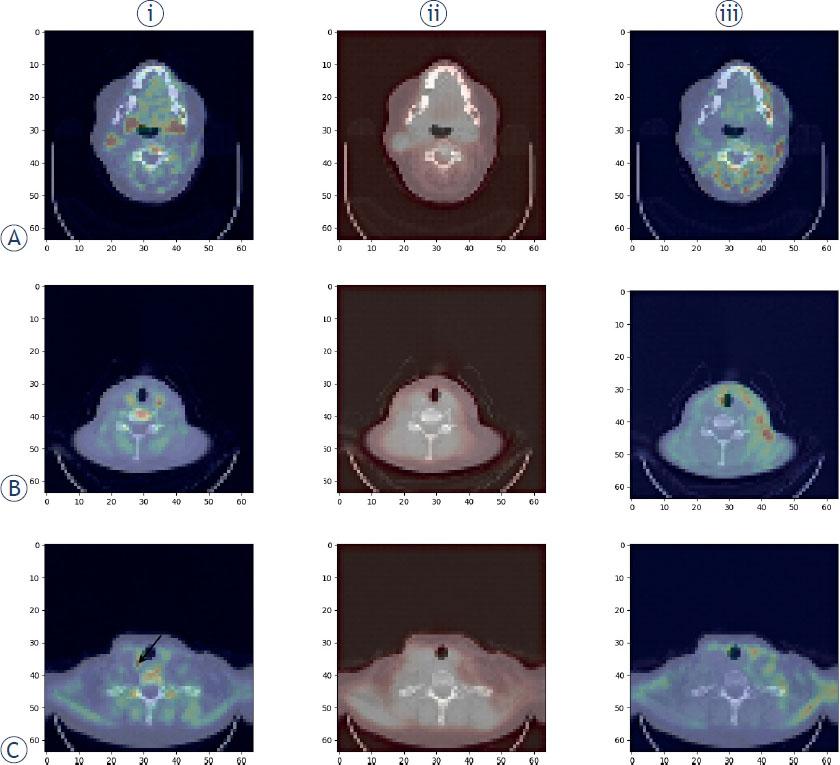
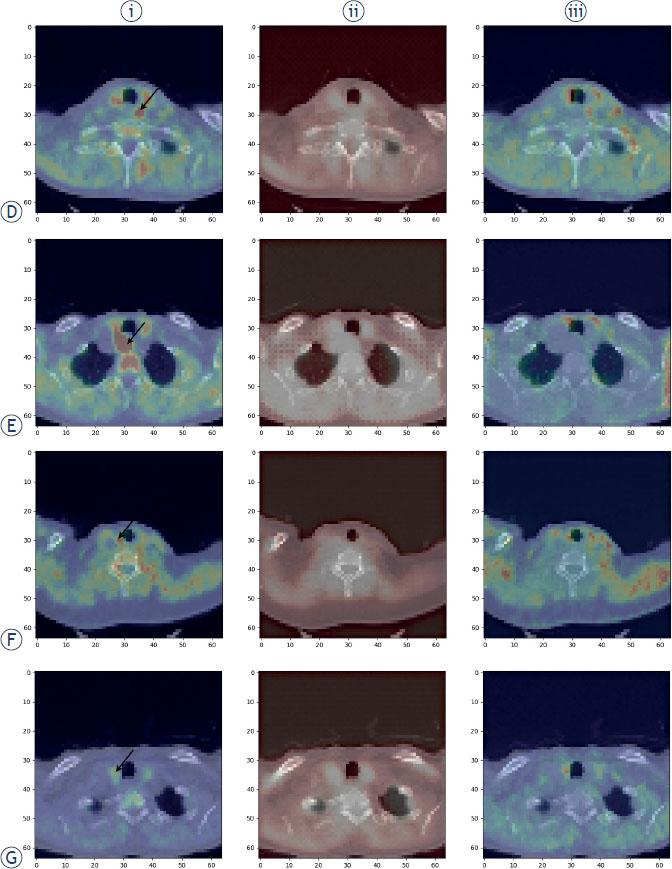
Figure 3
Confusion matrices for CPr (A) and CLoc (B) for both RN10 and mRN10 models_ Note that the confusion matrices for CLoc have more samples (360 in total), as they were computed by summing the confusion matrices for each of the three included locations (UL, LL, LR)
| CPr task with RN10 | CPr task with mRN10 | ||||||
|---|---|---|---|---|---|---|---|
| HPTT present | HPTT present not | sum | HPTT present | HPTT present not | sum | ||
| Model HPTT present output | 79 | 8 | 87 | Model HPTT present output | 90 | 11 | 101 |
| Model output HPTT not present | 20 | 13 | 33 | Model output HPTT not present | 9 | 10 | 19 |
| sum | 99 | 21 | 120 | sum | 99 | 21 | 120 |
Diagnostic performance metrics of RN10 and mRN10 as well as p-values as determined by McNemar test comparing both models for each task (except AUCROC)
| CPr RN10 | CPr mRN10 | CPr p-value | CLoc RN10 | CLoc mRN10 | CLoc p-value | |
|---|---|---|---|---|---|---|
| Sensitivity [95% CI] | 0.800 [0.719; 0.877] | 0.909 [0.852; 0.965] | 0.028 | 0.365 [0.268; 0.460] | 0.552 [0.453; 0.652] | 0.018 |
| Specificity [95% CI] | 0.619 [0.411; 0.827] | 0.476 [0.263; 0.690] | 0.257 | 0.807 [0.759; 0.854] | 0.811 [0.763; 0.858] | 0.910 |
| Positive predictive value [95% CI] | 0.908 [0.847; 0.969] | 0.891 [0.830; 0.951] | 0.507 | 0.407 [0.303; 0.511] | 0.515 [0.418; 0.611] | 0.089 |
| Negative predictive value [95% CI] | 0.394 [0.227; 0.560] | 0.526 [0.302; 0.751] | 0.205 | 0.777 [0.728; 0.827] | 0.833 [0.787; 0.878] | 0.021 |
| Accuracy [95% CI] | 0.767 [0.681; 0.839] | 0.833 [0.756; 0.895] | 0.050 | 0.689 [0.638; 0.736] | 0.742 [0.693 0.786] | 0.031 |
| AUCROC | 0.815 | 0.849 | / | 0.702 | 0.770 | / |
Comparison of mRN10 and human performance for the CLoc task_ p-values were determined by using the McNemar test
| CLoc mRN10 | CLoc human | p-value | |
|---|---|---|---|
| Sensitivity [95% CI] | 0.552 [0.453; 0.652] | 0.917 [0.857; 0.958] | < 0.001 |
| Specificity [95% CI] | 0.811 [0.763; 0.858] | 0.997 [0.986; 0.999] | < 0.001 |
| Positive predictive value [95% CI] | 0.515 [0.418; 0.611] | 0.992 [0.945; 0.999] | < 0.001 |
| Negative predictive value [95% CI] | 0.833 [0.787; 0.878] | 0.972 [0.952; 0.984] | < 0.001 |
| Accuracy [95% CI] | 0.742 [0.693; 0.786] | 0.977 [0.960; 0.988] | < 0.001 |
Performance of several models on CPr task
| Model name | mRN10 | RN10 | Resnet50 | Resnet101 | Densenet101 | PreActResnet101 | WideResnet101 |
|---|---|---|---|---|---|---|---|
| parameters # Trainable (millions) | 33.5 | 14.3 | 46.2 | 85.2 | 112.9 | 85.2 | 85.2 |
| Optimal learning initial rate | 0.0136 | 0.0136 | 2.15*10-3 | 1.47*10-4 | 0.316 | 1.47*10-4 | 2.15*10-3 |
| Mean CPr AUCROC [95% CI] | 0.850 [0.734; 0.998] | 0.812 [0.716; 0.994] | 0.754 [0.624; 0.980] | 0.527 [0.410; 0.639] | 0.703 [0.606; 0.905] | 0.739 [0.486; 0.998] | 0.752 [0.653; 0.966] |