
Figure 1
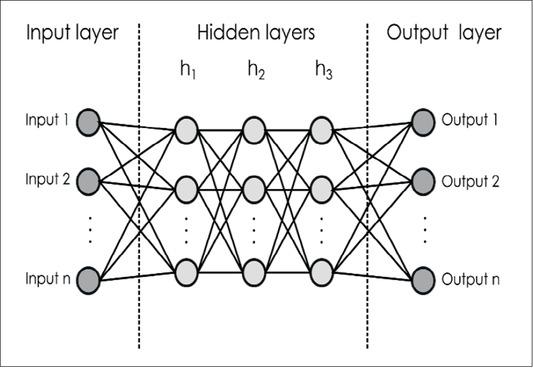
Figure 2
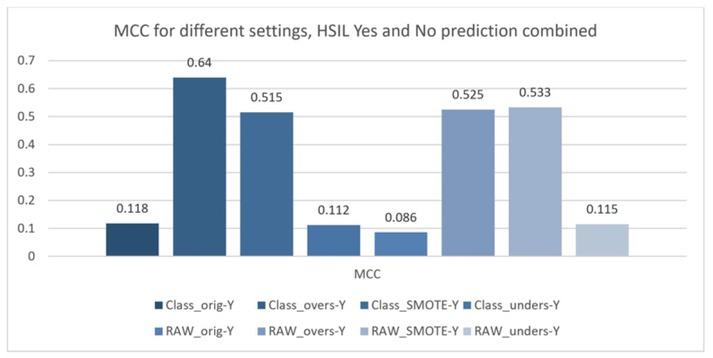
Figure 3
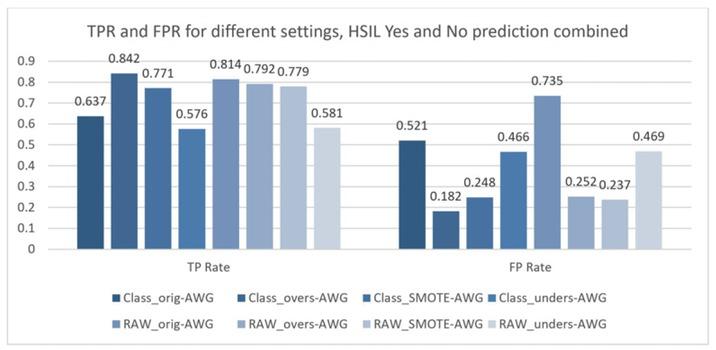
Figure 4
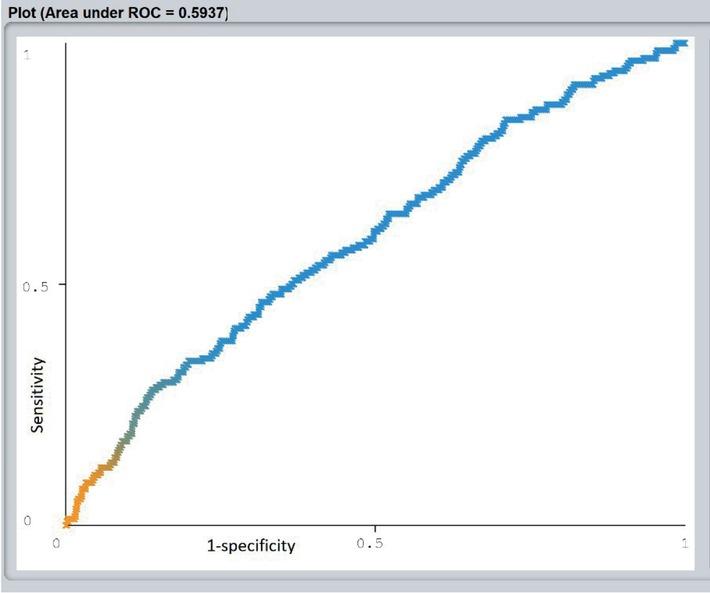
Figure 5
Number and percentage of patients according to human papilloma virus (HPV) 16 and 18 statuses in high grade squamous intraepithelial lesion (HSIL) and NO-HSIL group
| HPV 16 | HPV 18 | |||||||
|---|---|---|---|---|---|---|---|---|
| HSIL group | NO-HSIL group | HSIL group | NO-HSIL group | |||||
| Frequency | % | Frequency | % | Frequency | % | Frequency | % | |
| not performed | 177 | 14 | 29 | 16 | 172 | 13 | 27 | 15 |
| negative | 693 | 54 | 106 | 57 | 775 | 60 | 120 | 65 |
| positive | 419 | 32 | 51 | 27 | 342 | 27 | 39 | 20 |
| Total | 1289 | 100 | 186 | 100 | 1289 | 100 | 186 | 100 |
Results of multi-layer perceptron (MLP) classifications for different settings with baseline prediction – ZeroR, percentage of correct classification and Kappa statistic for all analysis_ Results are for prediction high grade squamous intraepithelial lesion (HSIL)-Yes (Y), prediction NO-HSIL (N) and weighted average for whole model (YES and NO combined) – Weighted average (AVG)_ In bold-type letters are results, where prediction by MLP is better than baseline prediction ZeroR
| TP Rate | FP Rate | Precision | Recall | F-Measure | MCC | ROC Area | PRC Area | Class | % Correct | Kappa | ZeroR % | |
|---|---|---|---|---|---|---|---|---|---|---|---|---|
| Class_orig–Y | 0.751 | 0.634 | 0.739 | 0.751 | 0.745 | 0.118 | 0.567 | 0.735 | Yes | 82.10 | 0.0965 | 87.39 |
| Class_orig–N | 0.366 | 0.249 | 0.308 | 0.366 | 0.373 | 0.118 | 0.567 | 0.377 | No | |||
| Class_orig–AVG | 0.637 | 0.521 | 0.633 | 0.637 | 0.635 | 0.118 | 0.567 | 0.629 | Weighted Avg | |||
| Class_overs–Y | 0.860 | 0.201 | 0.908 | 0.860 | 0.884 | 0.640 | 0.870 | 0.920 | Yes | 84.19 | 0.6376 | 69.79 |
| Class_overs–N | 0.799 | 0.140 | 0.712 | 0.799 | 0.753 | 0.640 | 0.870 | 0.703 | No | |||
| Class_overs–AVG | 0.842 | 0.182 | 0.849 | 0.842 | 0.844 | 0.640 | 0.870 | 0.855 | Weighted Avg | |||
| Class_SMOTE–Y | 0.797 | 0.274 | 0.834 | 0.797 | 0.815 | 0.515 | 0.802 | 0.850 | Yes | 77.08 | 0.5141 | 63.40 |
| Class_SMOTE–N | 0.726 | 0.203 | 0.673 | 0.726 | 0.699 | 0.515 | 0.802 | 0.669 | No | |||
| Class_SMOTE–AVG | 0.771 | 0.248 | 0.775 | 0.771 | 0.772 | 0.515 | 0.802 | 0.784 | Weighted Avg | |||
| Class_unders–Y | 0.669 | 0.559 | 0.636 | 0.669 | 0.652 | 0.112 | 0.542 | 0.608 | Yes | 57.64 | 0.1113 | 59.39 |
| Class_unders–N | 0.441 | 0.331 | 0.477 | 0.441 | 0.458 | 0.112 | 0.542 | 0.448 | No | |||
| Class_unders–AVG | 0.576 | 0.466 | 0.572 | 0.576 | 0.573 | 0.112 | 0.542 | 0.543 | Weighted Avg | |||
| RAW_orig–Y | 0.907 | 0.828 | 0.884 | 0.907 | 0.895 | 0.086 | 0.594 | 0.905 | Yes | 81.42 | 0.0856 | 87.39 |
| RAW_orig–N | 0.172 | 0.093 | 0.211 | 0.172 | 0.189 | 0.086 | 0.594 | 0.174 | No | |||
| RAW_orig–AVG | 0.814 | 0.735 | 0.799 | 0.814 | 0.806 | 0.086 | 0.594 | 0.813 | Weighted Avg | |||
| RAW_overs–Y | 0.825 | 0.285 | 0.870 | 0.825 | 0.847 | 0.525 | 0.837 | 0.905 | Yes | 79.21 | 0.523 | 69.79 |
| RAW_overs–N | 0.715 | 0.175 | 0.639 | 0.715 | 0.675 | 0.525 | 0.837 | 0.661 | No | |||
| RAW_overs–AVG | 0.792 | 0.252 | 0.800 | 0.792 | 0.795 | 0.525 | 0.837 | 0.831 | Weighted Avg | |||
| RAW_SMOTE–Y | 0.800 | 0.258 | 0.843 | 0.800 | 0.821 | 0.533 | 0.814 | 0.867 | Yes | 77.87 | 0.5318 | 63.4 |
| RAW_SMOTE–N | 0.742 | 0.200 | 0.681 | 0.742 | 0.710 | 0.533 | 0.814 | 0.691 | No | |||
| RAW_SMOTE–AVG | 0.779 | 0.237 | 0.784 | 0.779 | 0.780 | 0.533 | 0.814 | 0.802 | Weighted Avg | |||
| RAW_unders–Y | 0.688 | 0.575 | 0.636 | 0.688 | 0.661 | 0.115 | 0.551 | 0.614 | Yes | 58.08 | 0.1144 | 59.39 |
| RAW_unders–N | 0.425 | 0.313 | 0.482 | 0.425 | 0.451 | 0.115 | 0.551 | 0.466 | No | |||
| RAW_unders–AVG | 0.581 | 0.469 | 0.573 | 0.581 | 0.576 | 0.115 | 0.551 | 0.554 | Weighted Avg |
Confusion matrix for classification with all possible outcomes
| Predicted pos (PP) | Predicted neg (PN) | |
|---|---|---|
| Actual pos (P) | True positives (TP) | False negatives (FN) |
| Actual neg (N) | False positives (FP) | True negatives (TN) |
Final histology of the cone in patients without human papilloma virus (HPV) testing
| Frequency | Percent | |
|---|---|---|
| NO dysplasia | 9 | 1.8 |
| CIN 1 | 26 | 5.3 |
| CIN 1–2 | 27 | 5.4 |
| CIN 2 | 90 | 18.1 |
| CIN 2–3 | 55 | 11.1 |
| CIN 3 | 223 | 45.0 |
| CIS | 55 | 11.1 |
| invasive ca | 11 | 2.2 |
| Total | 496 | 100.0 |