
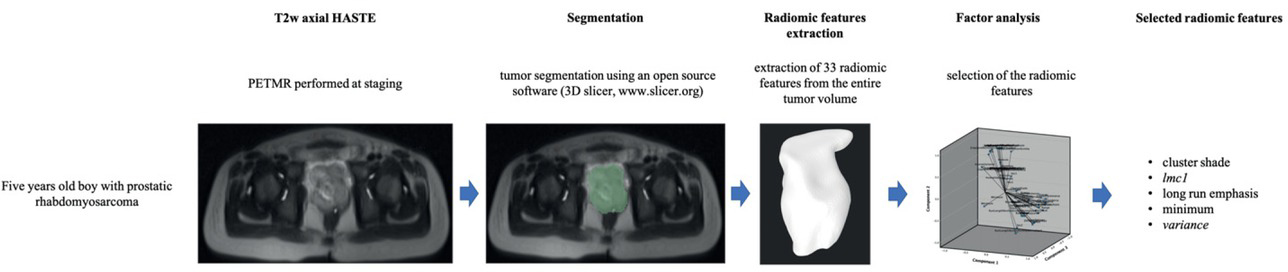
Figure 1
Graphic representation of the development of the proposed radiomic analysis demonstrating the segmentation and extraction of radiomic features from the primary lesion of children affected by soft tissue sarcomas examined for staging by PET/MR and the factor analysis that led to the selection of five highly correlating variables.
Table 1
Comparison of demographics, metabolic, and first-line laboratory variables according to tumor histotype and grade
| Histotype* | Grade# | |||||
|---|---|---|---|---|---|---|
| Rhabdomyosarcoma | Non-rhabdomyosarcoma | pa | Low-grade | High grade | pa | |
| Age (years) | 7.2 ± 4.8 | 9 ± 4.2 | 0.464 | 6.1 ± 3.4 | 9.5 ± 5.2 | 0.115 |
| Gender (female/male) | 7/5 | 4/2 | 1.000 | 7/2 | 4/5 | 0.335 |
| SUVmax | 5.1 ± 3 | 5.6 ± 3 | 0.765 | 5.3 ± 4 | 5.3 ± 2 | 0.998 |
| SUVmean | 1.8 ± 1 | 1.5 ± 1 | 0.505 | 1.1 ± 0.3 | 1 ± 0.2 | 0.960 |
| Hemoglobin (g/L) | 11.4 ± 1.3 | 11.7 ± 1.4 | 0.660 | 11.7 ± 1.6 | 11.4 ± 1 | 0.657 |
| Red (×10blood 12·L−1) cells count | 4.2 ± 1 | 4.7 ± 0.5 | 0.215 | 4.3 ± 1 | 4.5 ± 1 | 0.594 |
| White (×109·Lblood −1) cells count | 5.8 ± 3 | 5.8 ± 5 | 0.996 | 5.7 ± 4 | 6 ± 3.9 | 0.889 |
| Platelets (×109·L−1) | 349 ± 171 | 386 ± 77 | 0.636 | 375 ± 187 | 351 ± 100 | 0.748 |
| Lactate (U/L) dehydrogenase | 335 ± 86 | 369 ± 172 | 0.608 | 358 ± 131 | 331 ± 94 | 0.652 |
| D-(ng/dimer mL) | 214 ± 152 | 2125 ± 3530 | 0.07 | 1370 ± 2992 | 331 ± 297 | 0.315 |