
Figure 1
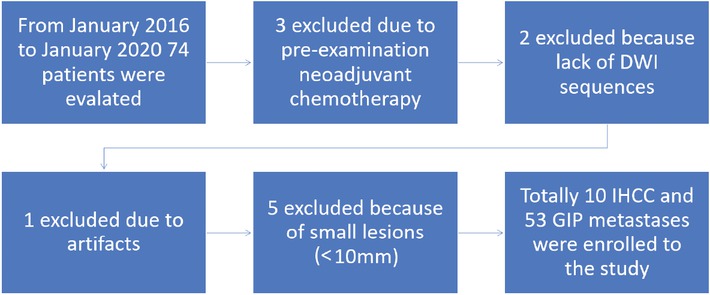
Flow-chart of the study showing the exclusion criteria of the patients.
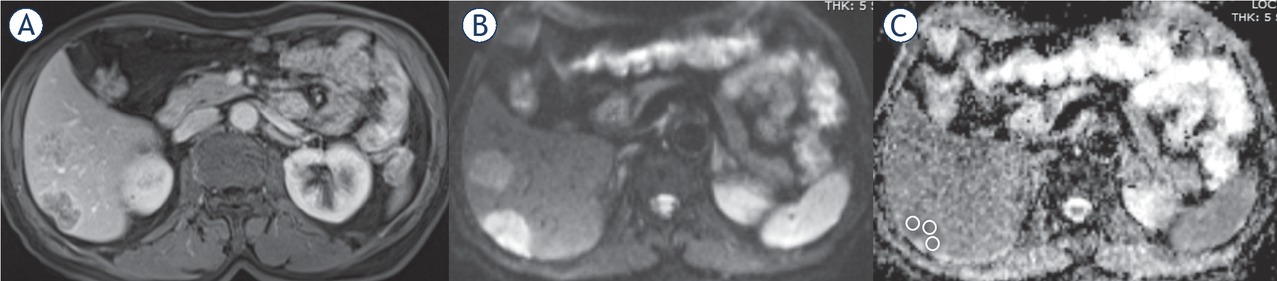
Figure 2
59-year-old male with liver metastases due to colorectal adenocarcinoma. Contrast-enhanced axial T1-weighted (T1W) (A), diffusion weighted image (DWI) obtained at b value of 800 s/mm2 (B) and apparent diffusion coefficient (ADC) maps (C) with free hand ROI placement technique.
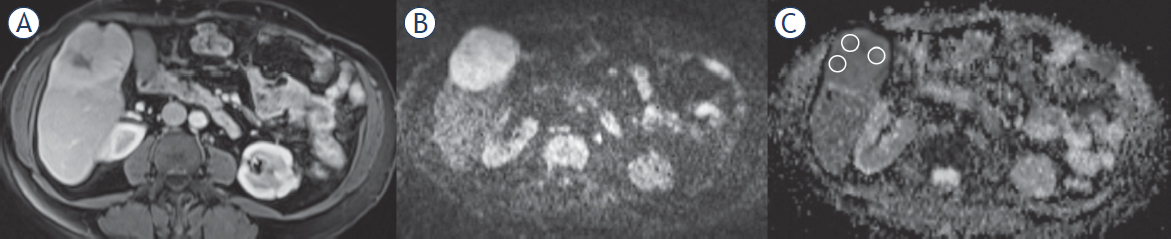
Figure 3
58-year-old female with an expansile liver mass with central hypovascular fibrous stroma and peripheral contrast enhancement on contrastenhanced axial T1-weighted (T1W) (A) images. diffusion weighted image (DWI) obtained at b value of 800 s/mm2 (B) and apparent diffusion coefficient (ADC) maps (C) with region of interests (ROI) placement with three different contrast enhancing area for calculating ADCmean values.
Table 1
Univariate analysis of patient characteristics for gastrointestinal system (GIS) liver metastases and intrahepatic cholangiocarcinoma (IHCC)
| Patient characteristics | Number of patients (n = 63) | IHCC (n = 10) | Liver metastases (n = 53) | P value |
|---|---|---|---|---|
| Age (years) | 61.4 ± 9.93 | 62.50 ± 13.49 | 61.15 ± 9.18 | 0.679 |
| Gender | < 0.001 | |||
| Male | 35 | 2 | 33 | |
| Female | 28 | 8 | 20 | |
| Diameter Location (mm) | 47 ± 31.27 | 82.70 ± 28.58 | 40.26 ± 27 | < < 0.001 0.001 |
| Right lobe | 24 | 2 | 38 | |
| Left lobe | 43 | 8 | 15 |
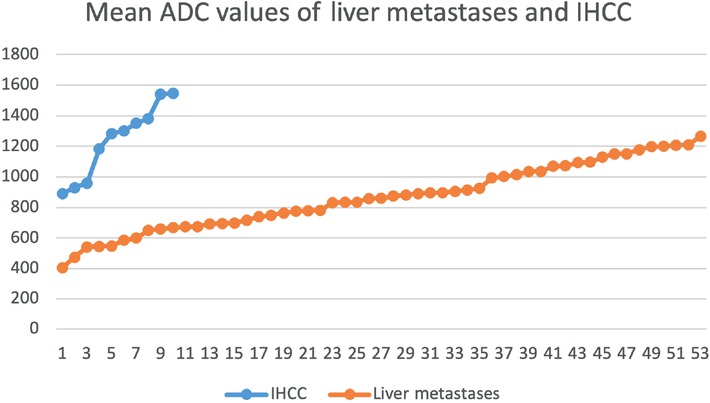
Figure 4
Mean apparent diffusion coefficient (ADCmean) values of liver metastases of gastrointestinal system adenocarcinomas and intrahepatic cholangiocarcinoma (IHCC).
Table 2
Apparent diffusion coefficient (ADC) values of intrahepatic cholangiocarcinoma (IHCC) and gastrointestinal system (GIS) liver metastases
| Patient Groups | ADC x 10-6mm/sn2 (median, IQR) |
| IHCC | (1293.0), (1422.0–951.75) |
| GIS metastases | (861.0), (1053.0–695.0) |
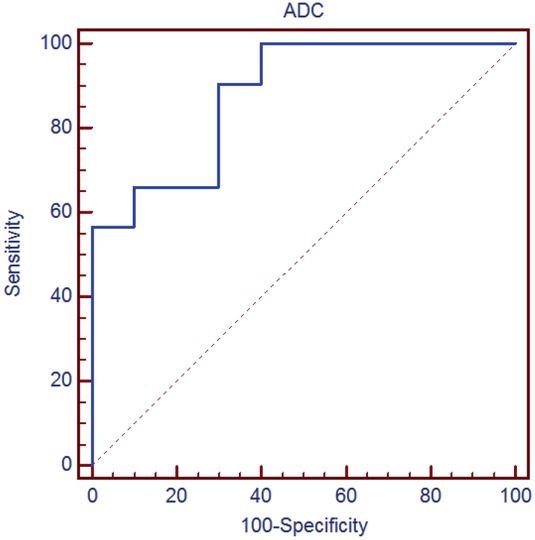
Figure 5
Receiver operating characteristic curve of the apparent diffusion coefficient (ADC) mean values.