
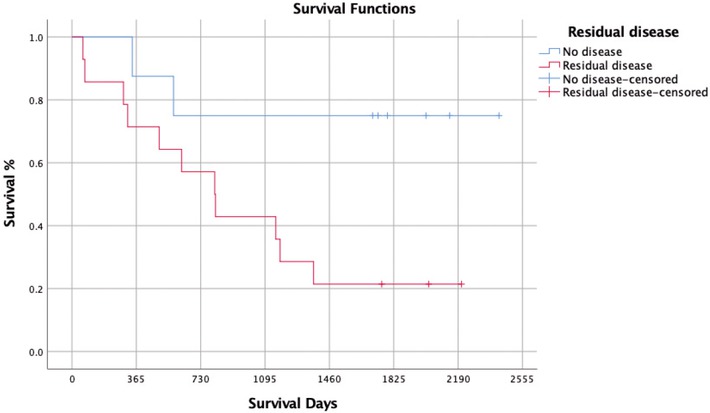
Figure 1
Kaplan-Meier comparing patients identified with or without residual disease following second surgery.
Table 1
Characteristics of patients with incidentally detected gallbladder cancer at the time of second surgery and survival characteristics at 1, 3, and 5 years after the intervention
| 1 year (n = 17) n (%) | 3 year (n = 12) n (%) | 5 year (n = 9) n (%) | ||
|---|---|---|---|---|
| Age at secondary intervention (years) | ||||
| < 65 | 7 (31.8) | 6 (35.3) | 3 (25.0) | 2 (22.2) |
| 65–75 | 10 (45.5) | 7 (42.2) | 6 (50.0) | 5 (55.6) |
| > 75 | 5 (22.7) | 4 (23.5) | 3 (50.0) | 2 (22.2) |
| Time between the two interventions (days) | ||||
| < 60 | 13 (59.1) | 11 (64.7) | 8 (66.7) | 6 (66.7) |
| > 60 | 9 (40.9) | 6 (35.3) | 4 (33.3) | 3 (33.3) |
| Residual disease in liver | ||||
| No | 15 (68.2) | 13 (76.5) | 12 (100.0) | 9 (100.0) |
| Yes | 7 (31.8) | 4 (23.5) | / | / |
| Positive lymph nodes | ||||
| No | 9 (40.9) | 7 (41.2) | 6 (50.0) | 6 (66.7) |
| Yes | 9 (40.9) | 6 (35.3) | 3 (25.0) | 2 (22.2) |
| No data | 4 (18.2) | 4 (23.5) | 3 (25.0) | 1 (11.1) |
| Secondary surgery | ||||
| 4b,5 segmentectomy + lymphadenectomy | 9 (41.0) | 9 (53.0) | 6 (50.0) | 4 (44.4) |
| 4b,5 segmentectomy + CBD resection | 9 (41.0) | 7 (41.2) | 6 (50.0) | 5 (55.6) |
| ALPPS + CBD resection | 1 (4.5) | / | / | / |
| Extended right hepatectomy + Whipple procedure | 1 (4.5) | 1 (5.8) | / | / |
| 4b,5,6 segmentectomy + resection of CBD, | 1 (4.5) | / | / | / |
| stomach and proximal duodenum | ||||
| CBD resection | 1 (4.5) | / | / | / |
| Stage | ||||
| Stage II | 9 (40.9) | 9 (52.9) | 7 (58.3) | 6 (66.7) |
| Stage III | 13 (59.1) | 8 (47.1) | 5 (41.7) | 3 (33.3) |
| Complications (Clavien-Dindo scale) | ||||
| None | 15 (68.2) | 14 (82.4) | 9 (75.0) | 7 (77.8) |
| Grade I | 1 (4.5) | 1 (5.9) | 1 (4.5) | 1 (11.1) |
| Grade II | 4 (18.3) | 2 (11.8) | 2 (16.7) | 1 (11.1) |
| Grade IVb | 1 (4.5) | / | / | / |
| Grade V | 1 (4.5) | / | / | / |
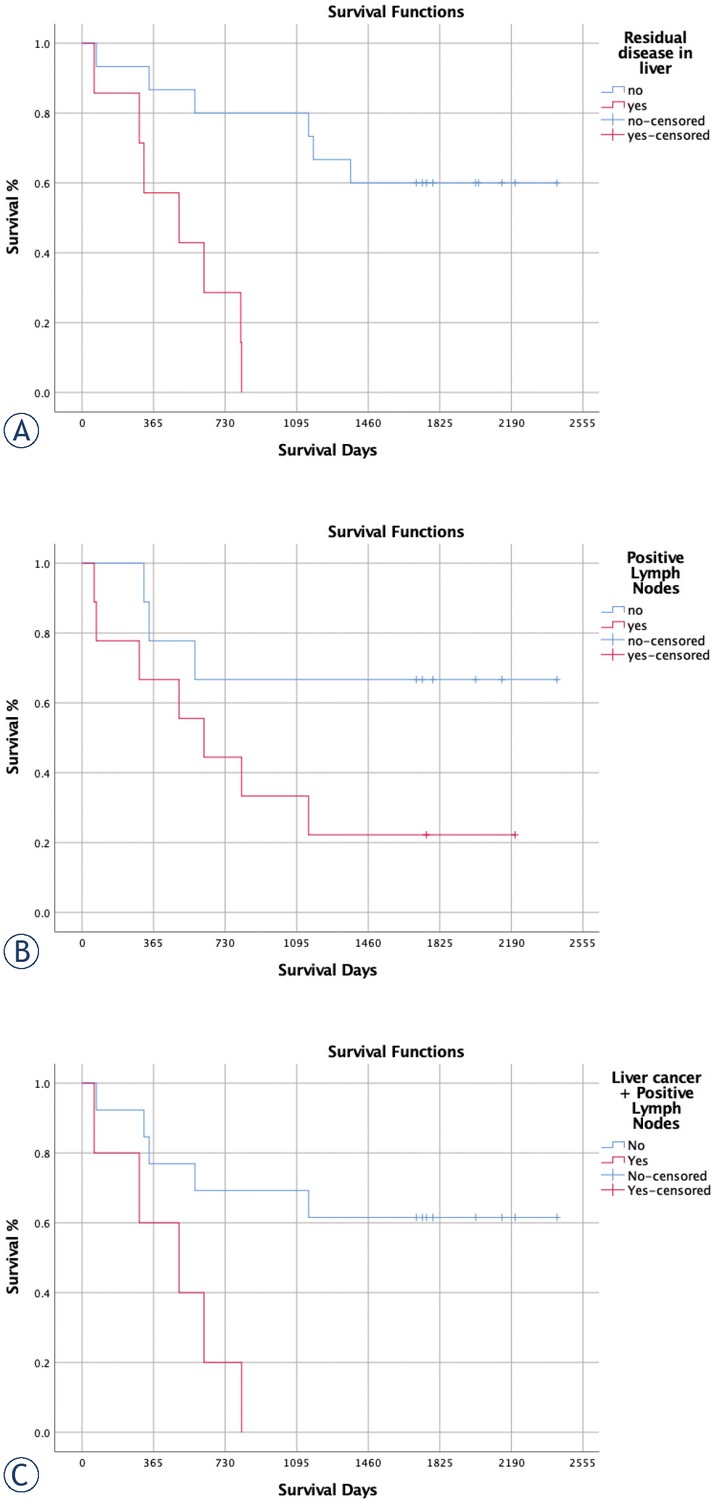
Figure 2
Kaplan-Meier comparing patients identified with or without residual disease in liver and positive lymph nodes following second surgery. (A) Residual disease in liver, (B) Positive Lymph Nodes), (C) Residual disease in liver and positive lymph nodes.
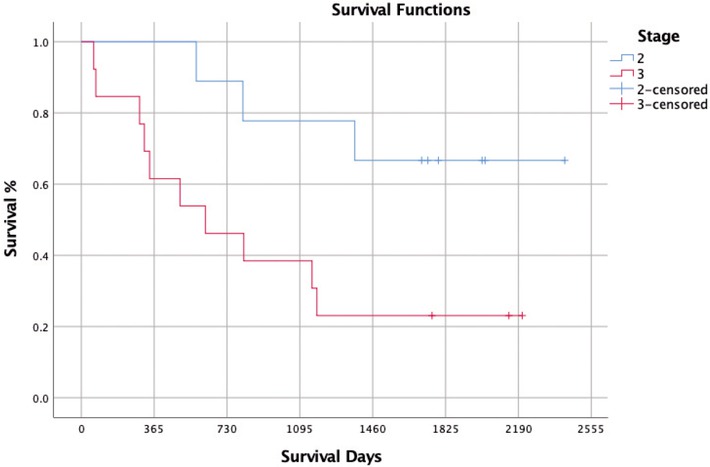
Figure 3
Kaplan-Meier comparing patients identified with II and III stage disease following second surgery.
Table 2
Output of the multivariate Cox regression model
| Variable | Beta | Standard error | p-value | Hazard ratio exp(Beta) | 95% confidence interval | |
|---|---|---|---|---|---|---|
| RD in liver or/and positive lymph nodes (Yes/No) | 1.253 | 0.792 | 0.114 | 0.286 | 0.061 | 1.349 |
| Stage (II/III) | 1.716 | 1.130 | 0.129 | 0.180 | 0.020 | 1.648 |
| Age | 0.027 | 0.033 | 0.415 | 1.028 | 0.962 | 1.097 |
| Days between the two operations | 0.001 | 0.002 | 0.717 | 0.999 | 0.996 | 1.003 |