
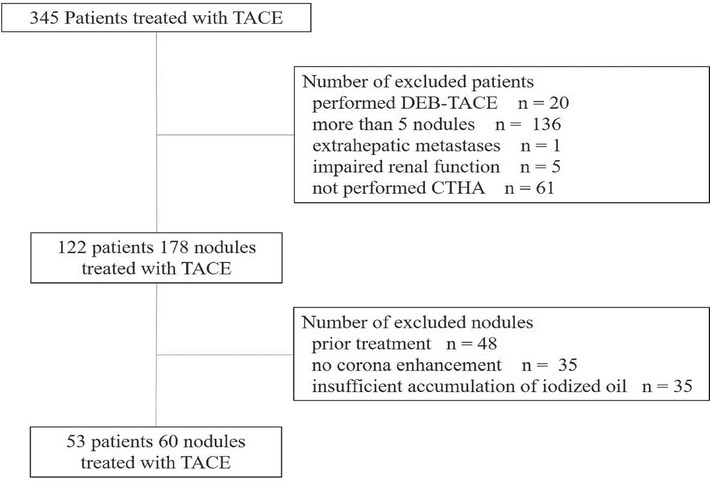
Figure 1
Flow diagram of patients’ and nodules’ selection.
CTHA = computed tomography during hepatic arteriography; DEB-TACE = drug-eluting beads transcatheter arterial chemoembolization; RFA = radiofrequency ablation; TACE = transcatheter arterial chemoembolization
Table 1
Clinical characteristics of nodules in group A and B
| Clinical characteristics | Group A (n = 36) | Group B (n = 24) | p value |
|---|---|---|---|
| Age, years* | 74 (70–79) | 71 (64–79) | 0.149 |
| Gender, male/female | 8/28 | 6/18 | 0.999 |
| Etiology (HCV/HBV/Alcohol/Unknown) | 16/8/8/4 | 9/5/6/4 | 0.912 |
| Child-Pugh classification (A/B) | 31/5 | 19/5 | 0.569 |
| BCLC stage(0/A/B) | 11/20/5 | 5/17/2 | 0.545 |
| Size of tumor, mm* | 14.5 (12–21.3) | 15.5 (11–22) | 0.757 |
| Thickness of corona enhancement(≤ 2mm/>2mm) | 17/19 | 10/14 | 0.793 |
| AFP, ng/ml* | 4.9 (2.6–10.6) | 5.9 (2.7–14.1) | 0.419 |
| DCP, mAU/mL* | 26.4 (17.0–49.2) | 48.8 (25.3–153.9) | 0.021 |
| Usage of miriplatin, mg* | 28 (20–38.5) | 30 (22.4–51.5) | 0.310 |
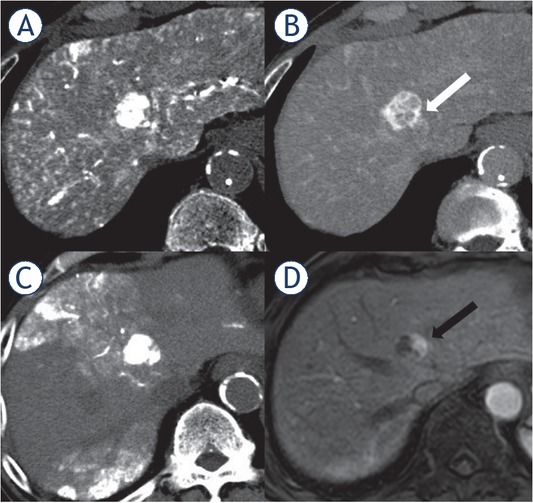
Figure 2
Local tumor recurrence after transcatheter arterial chemoembolization (TACE) in an 82-year-old patient with a hepatocellular carcinoma. (A) Early-phase computed tomography during hepatic arteriography (CTHA) demonstrated a hypervascular nodule in S5. (B) Late-phase CTHA demonstrated the corona enhancement around the tumor (white arrow). (C) Non-contrast-enhanced computed tomography performed immediately after TACE showed dense accumulation of iodized oil throughout the tumor, but not in the entire corona enhancement area. (D) In contrast enhanced magnetic resonance images obtained 4 months after TACE, local recurrence developed around the tumor (black arrow).
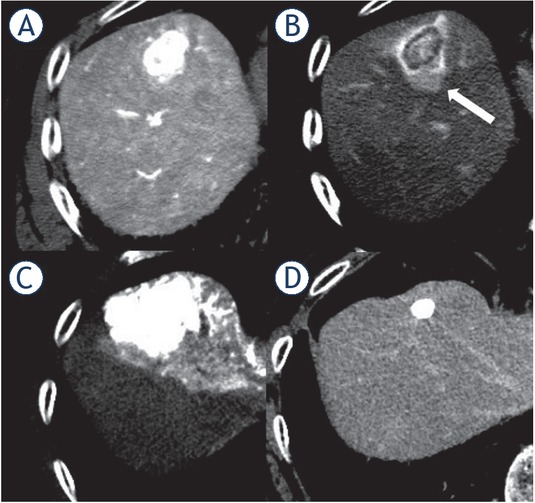
Figure 3
Complete response after transcatheter arterial chemoembolization (TACE) in a 77-year-old patient with a hepatocellular carcinoma. (A) Early-phase computed tomography during hepatic arteriography (CTHA) demonstrated a hypervacular nodule in S4. (B) Late-phase CTHA demonstrated the corona enhancement around the tumor (white arrow). (C) Non-contrast-enhanced computed tomography performed immediately after TACE showed dense accumulation of iodized oil beyond corona enhancement area. (D) Contrast-enhanced computed tomography performed 15 months after TACE showed no enhancement around the tumor.
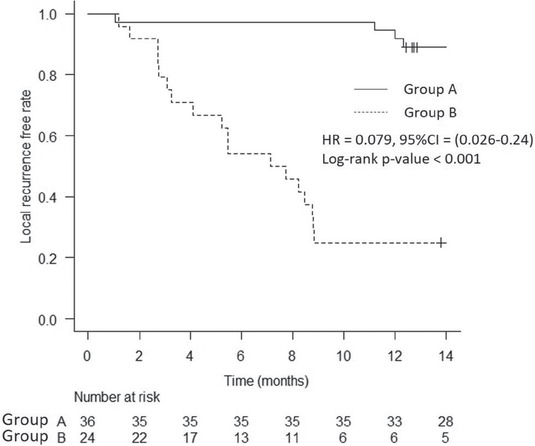
Figure 4
Local tumor recurrence-free rate according to the range of the embolization for transcatheter arterial chemoembolization (TACE). The cumulative 3-, 6-, 12-month tumor local recurrence rates were 2.8%, 2.8%, 8.3%, respectively, for cases with embolization of the entire corona enhancement area, and 20.8%, 45.8%, 75%, respectively, for cases without embolization of the entire corona enhancement area (hazard ratio [HR], 0.079; 95% confidence interval [CI], 0.026–0.24; p < 0.001).
Table 2
Univariate and multivariate logistic regression analysis for factor affecting local tumor recurrence
| Odds ratio (95% CI) | p value | Odds ratio (95% CI) | p value | |
|---|---|---|---|---|
| Size of tumor (< 20 vs. ≥ 20 mm) | 0.67 (0.20–2.32) | 0.577 | ||
| AFP (< 10 vs. ≥ 10 ng/mL) | 0.45 (0.13–1.61) | 0.242 | ||
| DCP (< 40 vs. ≥ 40 mAU/mL) | 0.59 (0.18–1.92) | 0.417 | ||
| Usage of miriplatin (< 30 vs. ≥ 30 mg) | 0.70 (0.17–1.89) | 0.420 | ||
| Thickness of corona enhancement (≤ 2mm/ > 2mm) | 0.97 (0.30–3.20) | 0.999 | ||
| Degree of iodized oil accumulation (Group A vs. B) | 0.045 (0.0080–0.20) | < 0.001 | 0.042 (0.010–0.17) | < 0.001 |