
Table 1
The parameters of the selected patients and irradiated volumes
| Sex | Age [years] | Lobe | GTV_volume [ccm] | Tumor movement [mm] | ITV_volume [ccm] | PTV_volume [ccm] |
|---|---|---|---|---|---|---|
| Male | 84 | Right-lower | 3.7 | 20 | 10.7 | 33.3 |
| Male | 66 | Left-upper | 1.3 | 4 | 2.2 | 11.5 |
| Male | 72 | Left-upper | 4.8 | 5 | 7.2 | 24.9 |
| Female | 61 | Right-mid | 2.6 | 4 | 3.9 | 15.1 |
| Female | 67 | Right-mid | 0.7 | 2 | 1.1 | 7.6 |
Table 2
The mean values and the standard deviations of the plan quality parameters
| 2 Gy/fraction | 3 Gy/fraction | 6 Gy/fraction | 12 Gy/fraction | 20 Gy/fraction | |
|---|---|---|---|---|---|
| PTV_Dmean (cGy) | 6706±96 | 6713±85 | 6701±97 | 6715±91 | 6686±96 |
| PTV_V95 (%) | 98.17±2.34 | 98.44±1.61 | 98.32±1.72 | 98.43±1.67 | 98.22±1.93 |
| PTV_V100 (%) | 91.12±5.29 | 91.85±4.34 | 91.31±4.63 | 91.82±4.54 | 90.78±4.93 |
| PTV_V98 (%) | 94.9±4.24 | 95.47±3.28 | 94.97±3.54 | 95.39±3.48 | 94.75±3.84 |
| PTV_D98 (cGy) | 5759±141 | 5771±116 | 5760±128 | 5773±126 | 5755±128 |
| PTV_D50 (cGy) | 6749±128 | 6762±107 | 6750±125 | 6760±119 | 6726±125 |
| PTV_D2 (cGy) | 7515±114 | 7472±94 | 7461±106 | 7487±91 | 7454±87 |
| ITV_Dmean (cGy) | 7234±150 | 7229±126 | 7113±301 | 7124±262 | 7106±272 |
| ITV_D98 (cGy) | 6867±130 | 6901±101 | 6862±152 | 6877±125 | 6848±144 |
| ITV_D50 (cGy) | 7242±154 | 7229±134 | 7221±145 | 7238±117 | 7219±105 |
| ITV_D2 (cGy) | 7581±164 | 7556±162 | 7531±150 | 7561±142 | 7539±166 |
| BODY_V100 (ccm) | 17.1±9.56 | 17.25±9.64 | 17.13±9.66 | 17.24±9.72 | 17.16±9.57 |
| BODY_V50 (ccm) | 75.02±35.16 | 75.09±35.17 | 74.96±35.68 | 75.31±35.79 | 74.74±35.45 |
| BODY_V98 (ccm) | 18.2±10.03 | 18.34±10.11 | 18.22±10.13 | 18.34±10.19 | 18.1±10.16 |
| Dmax (cGy) | 7816±128 | 7777±106 | 7731±106 | 7794±16 | 7691±288 |
| Lung_V5Gy (%) | 15.57±7.25 | 15.51±7.31 | 15.59±7.24 | 15.57±7.3 | 15.56±7.26 |
| Lung_V20Gy (%) | 4.25±2.32 | 4.28±2.33 | 4.25±2.33 | 4.27±2.34 | 4.26±2.34 |
| Lung_Dmean (cGy) | 342±148 | 343±149 | 342±149 | 343±149 | 342±149 |
| # MU / cGy | 2.84±0.15 | 2.81±0.1 | 2.8±0.12 | 2.81±0.11 | 2.81±0.12 |
| R50% | 4.27±0.52 | 4.27±0.51 | 4.25±0.51 | 4.27±0.5 | 4.24±0.49 |
| CI98%_PTV | 0.93±0.06 | 0.94±0.05 | 0.93±0.06 | 0.94±0.05 | 0.94±0.06 |
| CN98%_PTV | 0.9±0.03 | 0.91±0.02 | 0.91±0.02 | 0.91±0.02 | 0.91±0.03 |
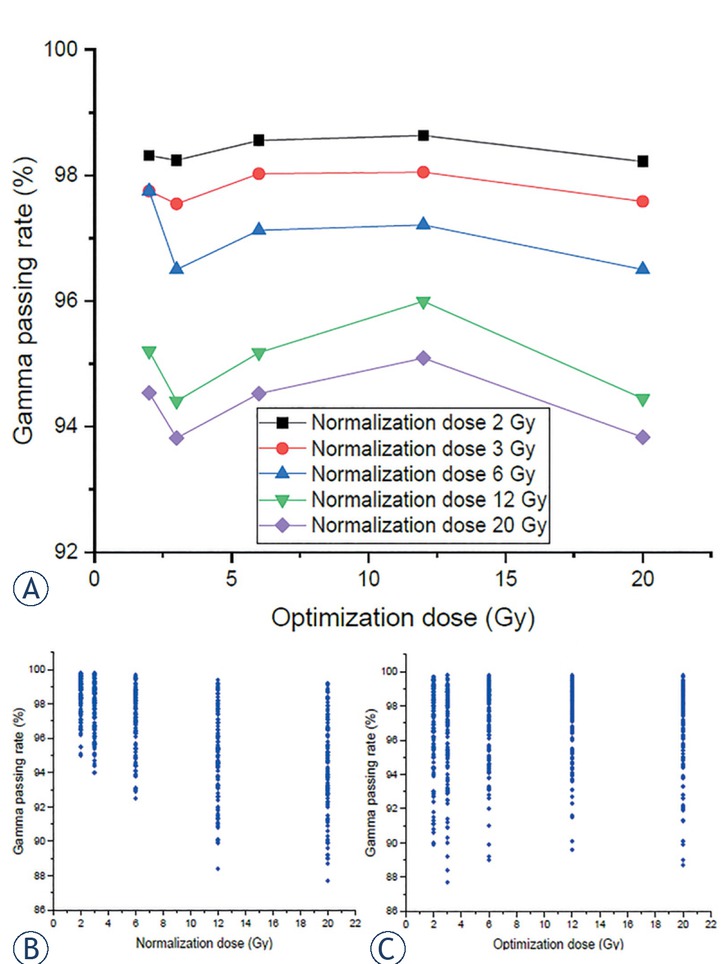
Figure 1
(A) The average value of gamma passing rates according to the used optimization separated by normalization, and the gamma passing rates according to the normalization (B) and optimization (C) dose values.
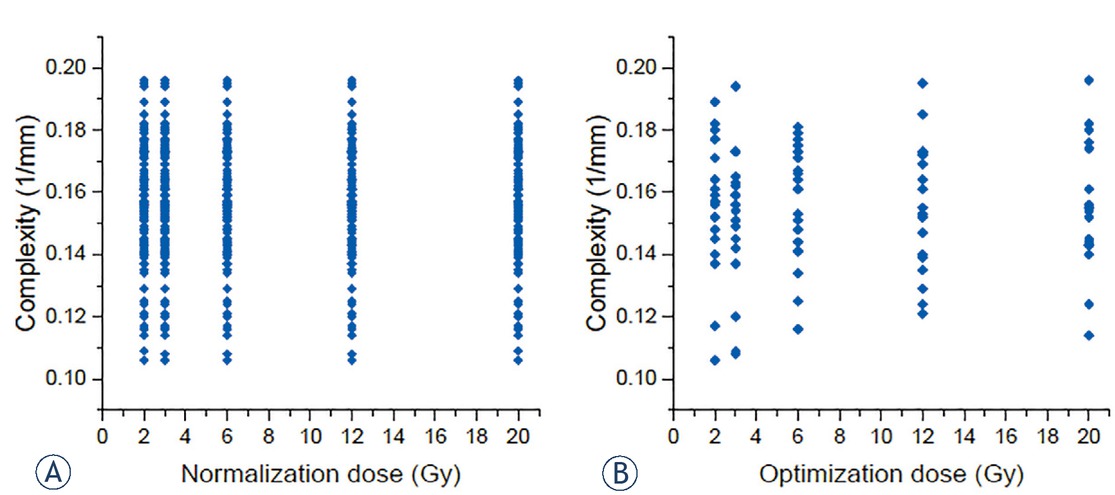
Figure 2
The effect of the normalization dose (A) and the optimization dose (B) values on the aperture complexity metric (ACM) score.
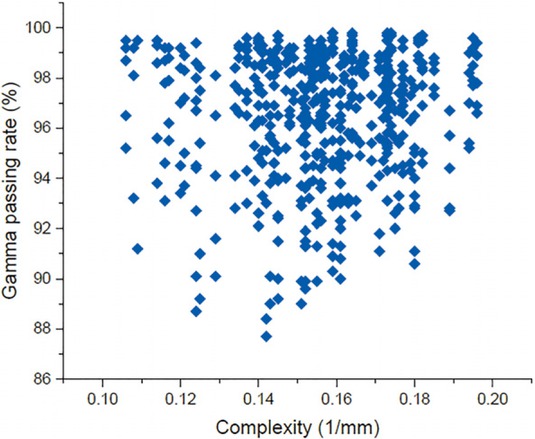
Figure 3
The connection between the complexity score and the gamma passing rate.
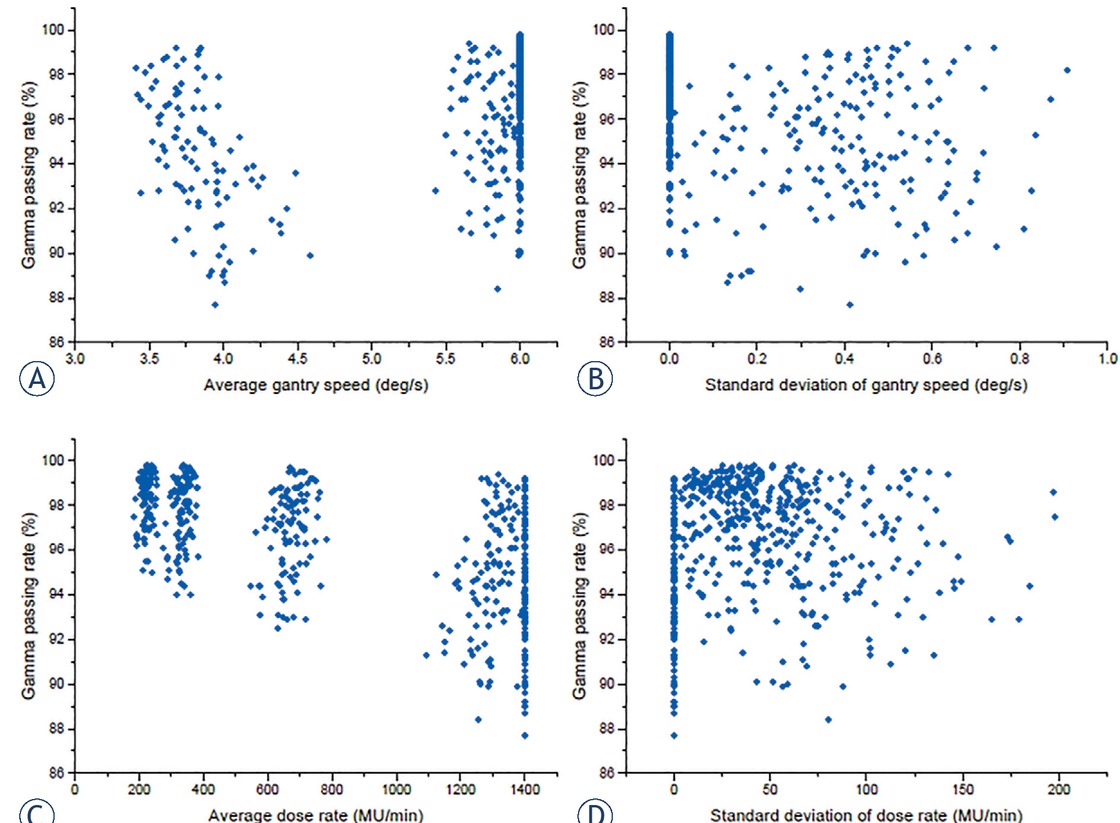
Figure 4
The effect of the average gantry speed (A) and standard deviation (B), and the average dose rate (C) and standard deviation (D) on the gamma passing rates.
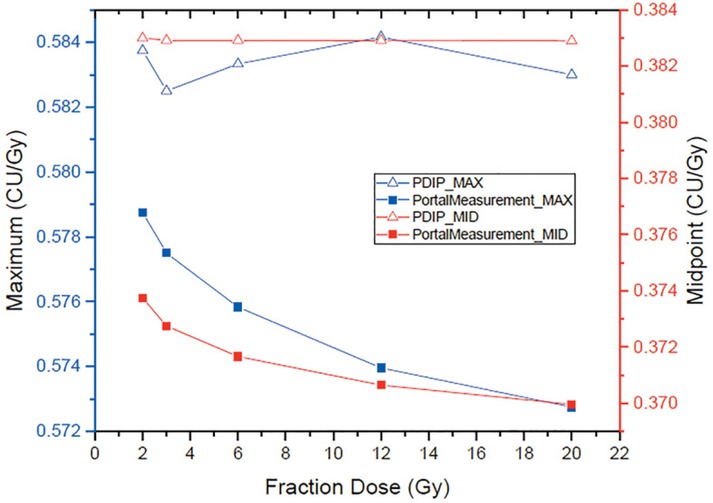
Figure 5
The predicted and measured number of maximum (blue) and the central-axis (red) calibrated units (CU) for 1 Gy according to the fraction dose.
PDIP = portal dose image prediction;