
Figure 1
Summary of the most important studies for definitive radiotherapy in patients with oral cavity cancer as an overview radiotherapy
| Study Period | Radiotherapy | No. of patients | CHT/IT | LDFS | PFS | OS | |
|---|---|---|---|---|---|---|---|
| Lin et al.18 | 1995–2007 | 42% IMRT | 115 | 48% | 27% (3yr) | n/a | 15% |
| CHT | (3yr) | ||||||
| 100% | 79% | 59% | 63% | ||||
| Foster et al.17 | 1994–2014 | 54% IMRT | 140 | CHT | (5yr) | (5yr) | (5yr) |
| Studer et al.8 | 2002–2011 | 100% IMRT | 54 | 68% | n/a | 37% | 37% |
| CHT/IT | (4yr) | (4yr) | |||||
| Pederson et al.9 | 2001–2004 | 100% IMRT | 21 | 100% | 76% | 71% | 76% |
| CHT | (5yr) | (5yr) | (5yr) | ||||
| Hosny et al.19 | 35% | 42% | 78% | 50% | |||
| 2005–2014 | 100% IMRT | 21 | CHT | (5yr) | (5yr) | (5yr) | |
| Present Study | 2000–2019 | 74% IMRT | 119 | 86.5% | 61.9% | 52.1% | 47.2% |
| CHT/IT | (5yr) | (5yr) | (5yr) |
Overview about univariable cox regression analysis for overall survival (OS), progression free survival (PFS), local disease-free survival (LDFS), and metastasis free survival (MFS) in patients with oral squamous cell carcinoma (OSCC) undergoing definitive radiotherapy
| Parameter | OS | PFS | LDFS | MFS | ||||
|---|---|---|---|---|---|---|---|---|
| HR | p-value | HR | p-value | HR | p-value | HR | p-value | |
| (95% CI) | (95% CI) | (95% CI) | (95% CI) | |||||
| Age (< 60 years) | 1.2 (0.6–2.2) | 0.637 | 0.9 (0.4–1.7) | 0.647 | 0.6 (0.3–1.3) | 0.224 | 3.4 (0.7–16.8) | 0.120 |
| Sex male vs. female | 1.2 (0.6–2.4) | 0.570 | 0.9 (0.5–2.0) | 0.950 | 1.1 (0.5–2.4) | 0.881 | 1.3 (0.3–5.1) | 0.741 |
| T Tstage 1/2 vs. T3/4 | 2.1 (1.1–4.2) | 0.036 | 1.3 (1.0–1.8) | 0.077 | 1.4 (0.9–2.0) | 0.072 | 2.1 (0.9–4.5) | 0.071 |
| N stage N0 vs. N+ | 2.1 (1.1–4.2) | 0.036 | 2.4 (1.1–5.3) | 0.026 | 2.7 (1.1–6.3) | 0.027 | 2.8 (0.8–5.4) | 0.071 |
| RT dose < 70.0 Gy vs. >/= 67.0 Gy | 1.9 (1.0–3.8) | 0.05 | 1.5 (0.7–3.1) | 0.267 | 1.4 (0.6–3.1) | 0.393 | 1.7 (0.4–7.0) | 0.428 |
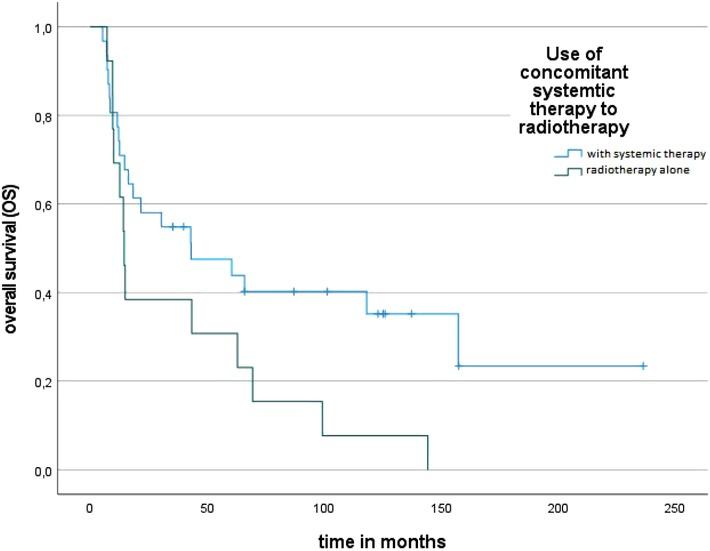
| Concomitant therapies | 2.1 (1.0–4.1) | 0.05 | 1.2 (0.9–1.5) | 0.227 | 1.5 (0.7–3.5) | 0.294 | 0.4 (0.1–3.3) | 0.409 |
| Concomitant therapies CHT vs. IT | 1.2 (0.9–1.5) | 0.216 | 1.5 (0.7–3.3) | 0.296 | 1.2 (0.6–2.7) | 0.586 | 0.7 (0.2–2.7) | 0.580 |
| RT technique IMRT vs. 3D | 0.6 (0.4–1.2) | 0.183 | 0.7 (0.3–1.3) | 0.258 | 0.7 (0.3–1.4) | 0.282 | 1.2 (0.3–5.0) | 0.765 |
| Risk factor history | 1.1 (0.8–1.4) | 0.536 | 0.9 (0.7–1.3) | 0.690 | 0.9 (0.6–1.1) | 0.328 | 1.5 (0.7–3.0) | 0.295 |
Early and late toxicity after radiotherapy
| Early treatment toxicity (< 90 days) | No of patients n (%) | Late treatment toxicity (> 90 days) | No of patients n (%) |
|---|---|---|---|
| CTCAE grade | CTCAE grade | ||
| Mucositis | |||
| 1 | 6 (13.0) | ||
| 2 | 19 (39.7) | ||
| 3 | 17 (35.6) | ||
| 4 | 2 (3.4) | ||
| Dermatitis | |||
| 1 | 12 (24.7) | ||
| 2 | 15 (31.5) | ||
| 3 | 5 (11.0) | ||
| Xerostomia | |||
| 1 | 15 (30.8) | 1 | 19 (39.7) |
| 2 | 4 (8.9) | 2 | 17 (35.6) |
| 3 | 1 (2.1) | 3 | 1 (2.1) |
| Dysphagia | |||
| 1 | 9 (19.2) | 1 | 15 (30.8) |
| 2 | 17 (34.9) | 2 | 5 (11.0) |
| 3 | 12 (24.0) | 3 | 4 (8.9) |
| Loss of taste (late toxicity) | |||
| 29 (60.0) | |||
| Trismus (late toxicity) | |||
| 13 (26.0) | |||
| Osteoradionecrosis (late toxicity) | |||
| 4 (8.9) |
RT treatment characteristics
| Technique | |
|---|---|
| 3D-CRT | 17 (34.7%) |
| IMRT | 32 (65.3%) |
| RT-Dose | |
| Median total dose base plan (without boost) | 57.5 Gy (range: 50.0–65.9 Gy) |
| Median single dose base plan (without boost) | 1.9 Gy (range: 1.7–2.1 Gy) |
| Boost | |
| Yes | 45 (91.8%) |
| SIB | 38 (84.4%) |
| Sequential | 7 (15.6%) |
| no | 4 (8.2%) |
| Median total dose boost plan | 12.0 Gy (range: 8.0–20.0 Gy) |
| Median single dose boost plan | 2.2 Gy (range: 2.0–2.2 Gy) |
| Cumulative total dose (base + boost plan) | 70.0 Gy (range: 60.0–72.0 Gy) |
| RT-Volume | |
| CTV dimension base plan | 829.6 ccm (range: 61.7–1554.4 ccm) |
| CTV dimension boost plan | 178.5 ccm (range: 31.4–535.8 ccm) |
Patient characteristics
| Characteristic | Number of patients (percentage) |
|---|---|
| Gender | |
| Male | 30 (61.2%) |
| Female | 19 (38.8%) |
| Age, years | |
| Median (range) | 61 years (17–85 years) |
| T-stage | |
| T1 | 8 (16.3%) |
| T2 | 12 (24.5%) |
| T3 | 7 (14.3%) |
| T4 | 22 (44.9%) |
| N-stage | |
| N0 | 20 (40.8%) |
| N+ | 29 (59.2%) |
| Grading | |
| 1 | 5 (10.2%) |
| 2 | 10 (20.4%) |
| 3 | 34 (69.4%) |
| Risk factors | |
| Smoking history | 29 (59.2%) |
| Alcohol consumption | 6 (12.2%) |
| none | 14 (28.6%) |