
Figure 1
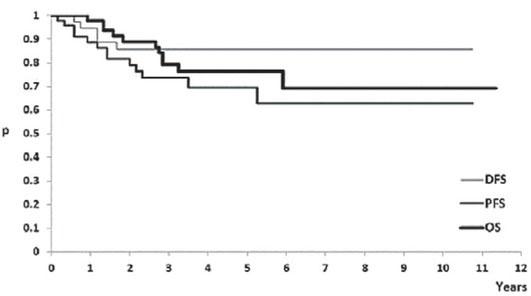
Figure 2
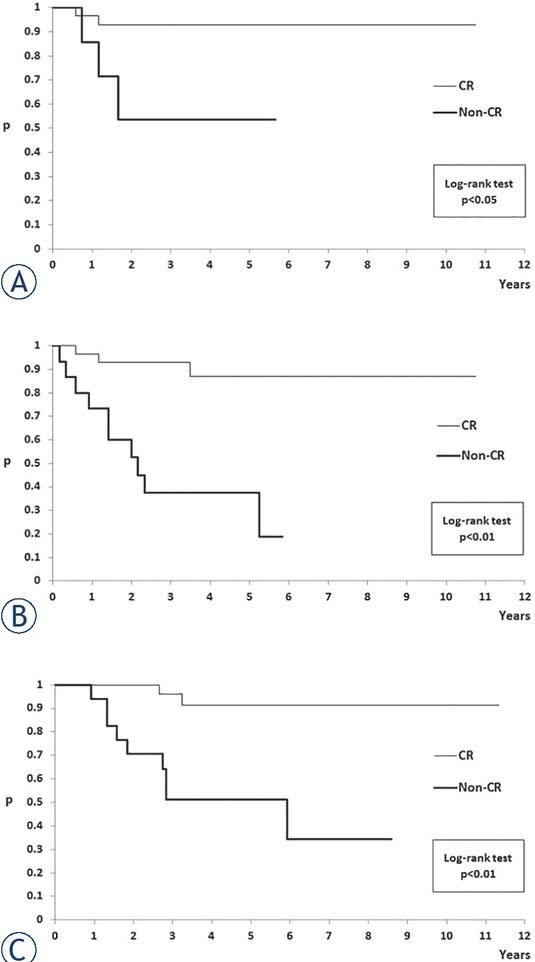
Figure 3
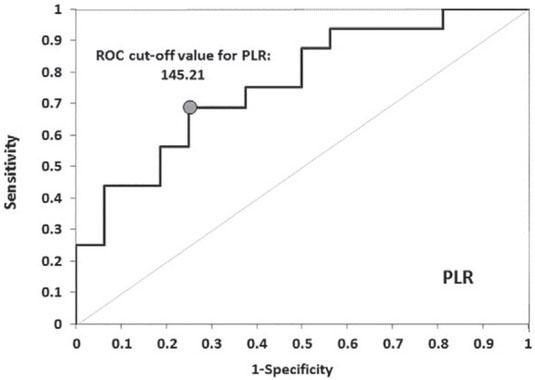
Results of the ROC analysis for neutrophil-to-lymphocyte ratio (NLR) and platelet-to-lymphocyte ratio (PLR) and relevant events
| Characteristics | NLR | PLR |
|---|---|---|
| AUC ROCa (95% CI) | 65.2% (45.3–85.2%) | 76.2% (59.5–92.9%) |
| Likelihood ratio testb | ns | p < 0.05 |
| ROC-cut-off valuec | - | 145.2 |
| Sensitivity (95% CI) | - | 68.7% (43.7–87.5%) |
| Specificity (95% CI) | - | 75.0% (56.1–93.7%) |
Patients’ disease, treatment and outcomes characteristics
| Characteristics | N (%) | Characteristics | N (%) |
|---|---|---|---|
| Age (years) | NLR | ||
| Mean (SD) | 61.9 (10.0) | Mean (SD) | 2.7 (1.7) |
| Median (Range) | 63.0 (40.0–81.0) | Median (Range) | 2.1 (0.8–7.0) |
| Gender | PLR | ||
| Female | 36 (76.6%) | Mean (SD) | 159.4 (92.1) |
| Male | 11 (23.4%) | Median (Range) | 132.9 (51.7–401.2) |
| Performance status (PS)1 | RT technique | ||
| ECOG 0 | 13 (27.7%) | 2D | 23 (48.9%) |
| ECOG 1 | 33 (70.2%) | 3D | 24 (51.1%) |
| ECOG 2 | 1 (2.1%) | The first RT part-dose (Gy) | |
| T in clinical TNM | Mean (SD) | 36.1 (1.6) | |
| T2 | 18 (38.3%) | Median (Range) | 36 (30–45) |
| T3 | 24 (51.1%) | The second RT part-dose (Gy) | |
| T4 | 5 (10.6%) | Mean (SD) | 22.8 (2.5) |
| N in clinical TNM | Median (Range) | 23.4 (9–26) | |
| N0 | 17 (36.2%) | Total dose (Gy) | |
| N1 | 30 (63.8%) | Mean (SD) | 58.9 (1.6) |
| UICC staging | Median (Range) | 59.4 (52–59.4) | |
| IIA | 10 (21.3%) | OTT (days) | |
| IIB | 7 (14.9%) | Mean (SD) | 74.7 (14.2) |
| IIIA | 8 (17.0%) | Median (Range) | 77 (51–134) |
| IIIC | 22 (46.8%) | Acute toxicity-first part | |
| Tumour differentiation | Without or gr. I/II | 26 (55.3%) | |
| well | 24 (51.1%) | Grade III/IV | 21 (44.7%) |
| moderate | 13 (27.7%) | Acute toxicity-second part | |
| poor | 4 (8.5%) | Without or gr. I/II | 32 (68.1%) |
| without data | 6 (12.8%) | Grade III/IV | 15 (31.9%) |
| Tumour size (cm) | Tumour response at 6 months | ||
| Mean (SD) | 5.2 (2.0) | CR | 30 (63.8%) |
| Median (Range) | 5.4 (2.1–10.0) | PR | 15 (31.9%) |
| Initial haemoglobin level (g/L) | SD | 1 (2.1%) | |
| Mean (SD) | 116.3 (20.3) | PD | 1 (2.1%) |
| Median (Range) | 124 (66–154) | Follow-up period (months) | |
| Pretreatment colostomy | Mean (SD) | 53.0 (30.9) | |
| No | 42 (89.4%) | Median (Range) | 44 (11–136) |
| Yes | 5 (10.6%) | Total | 47 (100%) |
Comparison of characteristics of complete responders (CR) and non-complete responders (non-CR) to chemoradiotherapy
| Characteristic | The response to treatment after 6 months | ||
|---|---|---|---|
| CR | non-CR | rank Wilcoxon sum test | |
| Age (years) | |||
| Mean (SD) | 60 (10.7) | 65.1 (7.8) | ns |
| Median (Range) | 59.5 (40.0–80.0) | 65.0 (52.0–81.0) | |
| Gender | |||
| Male | 6 (20%) | 5 (29.4%) | ns* |
| Female | 24 (80%) | 12 (70.6%) | |
| T in clinical TNM | |||
| T2 | 13 (43.3%) | 5 (29.4%) | |
| T3 | 14 (46.7%) | 10 (58.2%) | ns# |
| T4 | 3 (10.0%) | 2 (11.8%) | |
| N in clinical TNM | |||
| N0 | 15 (50.0%) | 2 (11.8%) | |
| N1 | 15 (50.0%) | 15 (88.2%) | p* < 0.05 |
| Tumour size (cm) | |||
| Mean (SD) | 4.7 (1.8) | 6.0 (2.1) | p < 0.05 |
| Median (Range) | 4.9 (2.1–8.0) | 5.8 (2.3–10.0) | |
| Initial haemoglobin level (g/L) | |||
| Mean (SD) | 124.2 (16.9) | 103.0 (18.8) | p < 0.01 |
| Median (Range) | 127.0 (66.0–154.0) | 101.0 (68.0–132.0) | |
| Pretreatment colostomy | |||
| No | 28 (93.3%) | 14 (82.3%) | |
| Yes | 2 (6.7%) | 3 (17.6%) | ns# |
| Neutrophil-to-lymphocyte ratio | |||
| N (%) | 16/30 (50%) | 16/17 (50%) | |
| Mean (SD) | 2.4 (1.8) | 3.1 (1.6) | ns |
| Median (Range) | 1.9 (0.8–7.0) | 3.2 (0.9–5.6) | |
| Platelet-to-lymphocyte ratio | |||
| N (%) | 16/30 (50%) | 16/17 (50%) | |
| Mean (SD) | 118.3 (54.9) | 200.5 (104.4) | |
| Median (Range) | 108.3 (51.7–256.6) | 158.9 (79.5–401.2) | p < 0.05 |
| DFS (months) | |||
| Median (95% CI) | NR | NR | p$ < 0.05 |
| PFS (months) | |||
| Median (95% CI) | NR | 26 (> 17) | p$ < 0.01 |
| OS (months) | |||
| Median (95% CI) | NR | 71 (> 33) | p$ < 0.01 |
| ACSOS (months) | |||
| Median (95% CI) | NR | NR | p$ < 0.05 |
| CFS (months) | |||
| Median (95% CI) | NR | 11 (> 10) | p$ < 0.01 |
| Total | 30 (100%) | 17 (100%) | - |
The value of neutrophil-to-lymphocyte ratio (NLR) and platelet-tolymphocyte ratio (PLR) in prediction of CR vs_ non-CR
| Characteristic | The response to treatment after 6 months | ||
|---|---|---|---|
| CR | non-CR | Fisher Exact Test | |
| NLR (literature cut-off value) | |||
| < 3.0 | 13 (81.2%) | 7 (43.8%) | |
| ≥ 3.0 | 3 (18.8%) | 9 (56.2%) | p = 0.06 |
| PLR (literature cut-off value) | |||
| < 160.0 | 13 (81.2%) | 9 (56.2%) | |
| ≥ 160.0 | 3 (18.8%) | 7 (43.8%) | p = 0.25 |
| PLR (ROC cut-off value) | |||
| < 145.2 | 12 (75%) | 5 (31.3%) | |
| ≥ 145.2 | 4 (25%) | 11(68.7%) | p = 0.03 |
| Total | 16 (100%) | 16 (100%) | - |
Logistic regression analysis of the response to treatment after 6 months
| Characteristic | Logistic regression | |||
|---|---|---|---|---|
| Univariate | Multivariate | |||
| OR (95%CI) | Wild test | OR (95%CI) | Likelihood Ratio test | |
| Age | ||||
| > 63 y vs. ≤ 63 y | 1.7 (0.4–6.6) | p = 0.213 | - | p = 0.884 |
| Gender | ||||
| Male vs. Female | 2.1 (0.6–7.2) | p = 0.468 | - | p = 0.082 |
| T in clinical TNM | ||||
| T3 vs. T2 T4 vs. T2 | 1.9 (0.5–6.9) 1.7 (0.2–13.7) | p = 0.634 | - | p = 0.940 |
| N in clinical TNM | ||||
| N1 vs. N0 | 7.5 (1.4–38.7) | p = 0.006 | - | p = 0.133 |
| Tumour size (cm) | ||||
| > 4 cm vs. ≤ 4 cm | 6.6 (1.3–33.8) | p = 0.011 | - | p = 0.602 |
| Initial haemoglobin level (g/L) | ||||
| < 120 g/L vs. ≥ 120 g/L | 8.9 (2.2–35.6) | p = 0.001 | 13.4 (2.4–74.3) | p* = 0.003 |
| RT technique | ||||
| 2D vs. 3D | 1.3 (0.4–4.2) | p = 0.679 | - | p = 0.784 |
| Treatment break | ||||
| > 10 days vs. ≤ 10 days | 6.0 (1.6–22.3) | p = 0.005 | 9.6 (1.7–52.5) | p* = 0.009 |
| Completed chemotherapy | ||||
| No vs. Yes | 2.0 (0.4–9.3) | p = 0.379 | - | p = 0.555 |