
Figure 1
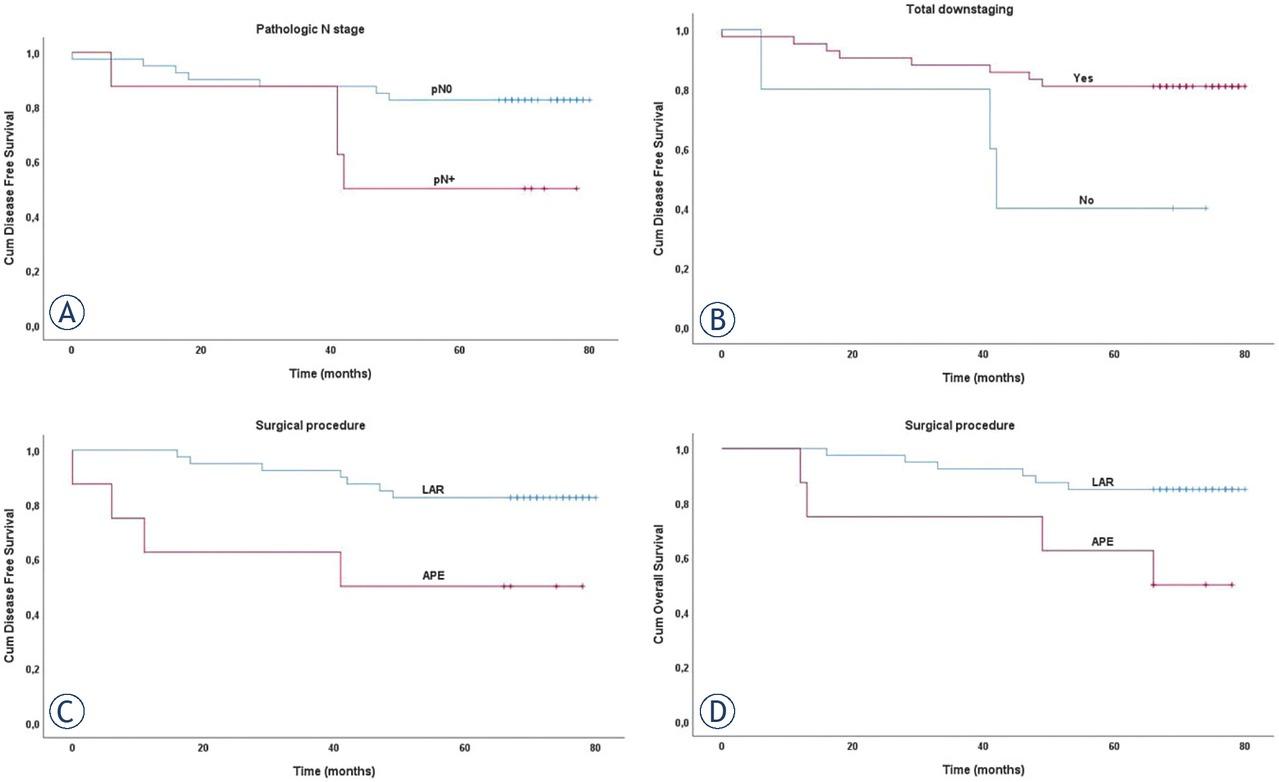
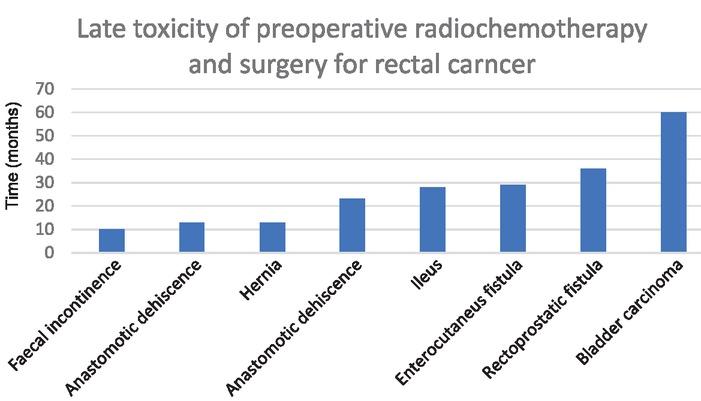
Figure 2
Number of events after median follow-up of 70 months (11–80 m) and 5-year survival
| Intention to treat (N = 51) | Per protocol (N = 47) | |
|---|---|---|
| 5-year OS* | 76.5% | 80.9% |
| 5-year DFS | 72.5% | 76.5% |
| 5-year LC | 90.2% | 95.7% |
| Number of events (%) | Number of events (%) | |
| OS status | ||
| Alive | 38 (74.5) | 37 (78.7) * |
| Dead | 13 (25.5) | 10 (21.3) |
| DFS status | ||
| Alive without disease | 37 (72.5) | 36 (76.5) |
| Local/distant relapse/death | 14 (27.5) | 11 (23.5) |
| LC status | ||
| Local relapse - | 46 (90.2) | 45 (95.7) |
| Local relapse + | 5 (9.8) | 2 (4.3) |
Late toxicity after preoperative radiochemotherapy, surgery and adjuvant chemotherapy according to CTCAE version 5_020
| G1, n (%) | G2, n (%) | G3, n (%) | G4, n (%) | G5, n (%) | |
|---|---|---|---|---|---|
| Anastomotic dehiscence | - | 1 (2.1) | 3 (6.3) | - | - |
| Anastomotic stenosis | 4 (10.0) | - | - | - | - |
| Ileus | - | - | - | - | 1 (2.1) |
| Hernia | 4 (8.3) | 1(2.1) | 1(2.1) | - | - |
| Abdominal or pelvic pain | 11 (22.9) | 3 (6.3) | - | - | - |
| Anal stenosis | 5 (10.4) | - | - | - | - |
| Fistula | - | 1 (2.1) | 2 (4.2) | - | - |
| Bloating | 21 (43.8) | 3 (6.3) | - | - | - |
| Constipation | 10 (20.8) | 4 (8.3) | - | - | - |
| Diarrhoea | 9 (18.8) | 5 (10.4) | - | - | - |
| Faecal incontinence | 6 (15.4) | 12 (30.8) | 3 (7.7) | - | - |
| Faecal urgency* | 5 (13.2) | 1(2.6) | - | - | - |
| Flatulence | 25 (52.1) | 6 (12.5) | - | - | - |
| Haemorrhoidal haemorrhage | 1 (2.1) | - | - | - | - |
| Haemorrhoids | 3 (6.3) | - | - | - | - |
| Proctitis | 1 (2.1) | - | - | - | - |
| Intestinal stoma leak | 2 (8.3) | - | - | - | - |
| Dysuria | 1 (2.1) | - | - | - | - |
| Urinary frequency | 13 (27.1) | - | - | - | - |
| Urinary incontinence | 9 (18.8) | 4 (8.3) | 1 (2.1) | - | - |
| Urinary retention | 1 (2.1) | 1 (2.1) | - | - | - |
| Urinary urgency | 21 (43.8) | 1 (2.1) | - | - | - |
| Ejaculation disorder (n = 20) | 5 (25) | 1 (5) | - | - | - |
| Erectile disfunction (n=20) | 2 (10.0) | 6 (30.0) | 2 (10.0) | - | - |
| Dyspareunia (n=18) | 1 (5.6) | 2 (11.1) | 1 (5.6) | - | - |
| Vaginal dryness (n = 18) | 1 (5.6) | 3 (16.7) | 1 (5.6) | - | - |
| Vaginal stricture (n = 18) | 1 (5.6) | 1 (5.6) | 1 (5.6) | - | - |
| Treatment-related secondary malignancy | - | - | 1 (2.0) | - | - |
| Other** | - | - | - | - | - |
Influence of probable prognostic factors on OS and DFS
| Intention to treat (N = 51) | Per protocol (N = 47) | |||
|---|---|---|---|---|
| Prognostic factor | OS | DFS | OS | DFS |
| Age at diagnosis (≥ 65 years vs. <65 years) | ns | ns | ns | ns |
| Gender (male vs. female) | p = 0.044 | ns | p = 0.064 | ns |
| PS WHO | ns | ns | ns | ns |
| Tumour grade | ns | ns | ns | ns |
| Tumour location (upper/ middle/lower rectal third) | ns | ns | ns | ns |
| MRI + | ns | ns | ns | ns |
| Extramesorectal lymph nodes (positive/negative) | ns | ns | ns | ns |
| Time to treatment(≤ 7w / > 7w) | p = 0.045 | ns | ns | ns |
| Surgery procedure (APE and pelvic exenteration/LAR) | p = 0.000 | p = 0.013 | p = 0.020 | p = 0.016 |
| cT stagea | ns | ns | ns | ns |
| cN stagea | ns | ns | ns | ns |
| Decrease in T stage | ns | ns | ns | ns |
| Decrease in N stage | ns | ns | ns | ns |
| Total downstaging | ns | p = 0.029 | ns | p = 0.029 |
| pT stage (0-2 vs. 3-4) | ns | ns | ns | ns |
| pN stage (0 vs. +) | ns | p = 0.044 | ns | p = 0.019 |
| Ekstramesorectal lymp node removal | ns | ns | ns | ns |
| pCR | ns | ns | ns | ns |
| TRG prognostic group | ns | ns | ns | ns |
| NAR prognostic group | ns | ns | ns | ns |
| Adjuvant chemotherapyb (5-6 / ≤ 4 cycles) | ns | ns | ns | ns |
| Treatment per protocol | p = 0.006 | p = 0.001 | / | / |
Health-related quality of life analysis: Mean scores comparisons 5 years after treatment with general Slovenian population38 and with EORTC reference values for colorectal cancer patients39 for all scales of EORTC QLQ-C30
| Scale | 5-year post-surgery mean (SD) | General Slovenian population mean (SD) | p value* | Colorectal reference values mean (SD) | p value* |
|---|---|---|---|---|---|
| Global health status/QoL | 60.8 (26.1) | 71.1 (21.4) | 0.035 | 62.1 (23.4) | 0.759 |
| Functional scales | |||||
| Physical function | 78.9 (24.5) | 91.8 (14.0) | 0.006 | 83.0 (21.1) | 0.285 |
| Role function | 77.4 (26.0) | 88.7 (20.1) | 0.022 | 70.4 (32.8) | 0.238 |
| Emotional function | 74.7 (25.0) | 82.0 (18.5) | 0.115 | 68.9 (24.5) | 0.192 |
| Cognitive function | 78.0 (24.5) | 90.2 (16.0) | 0.009 | 85.2 (20.4) | 0.052 |
| Social function | 78.5 (24.8) | 90.9 (17.3) | 0.009 | 76.0 (28.6) | 0.629 |
| Symptom scales | |||||
| Fatigue | 29.4 (23.2) | 19.8 (19.8) | 0.029 | 34.7 (28.4) | 0.302 |
| Nausea/vomiting | 6.5 (10.3) | 3.3 (10.6) | 0.097 | 7.3 (17.2) | 0.796 |
| Pain | 21.0 (23.2) | 14.5 (20.2) | 0.130 | 24.0 (29.6) | 0.575 |
| Dyspnoea | 10.8 (23.4) | 5.3 (15.3) | 0.204 | 17.4 (26.3) | 0.160 |
| Insomnia | 30.1 (30.3) | 19.8 (25.1) | 0.067 | 30.5 (32.6) | 0.946 |
| Appetite loss | 12.9 (22.2) | 5.3 (15.5) | 0.067 | 19.1 (30.2) | 0.256 |
| Constipation | 20.4 (26.8) | 6.9 (16.9) | 0.009 | 15.8 (27.9) | 0.363 |
| Diarrhoea | 16.1 (22.6) | 4.2 (13.6) | 0.006 | 16.6 (27.6) | 0.920 |
| Financial problems | 22.6 (29.0) | 6.6 (17.5) | 0.005 | 13.6 (26.3) | 0.059 |