
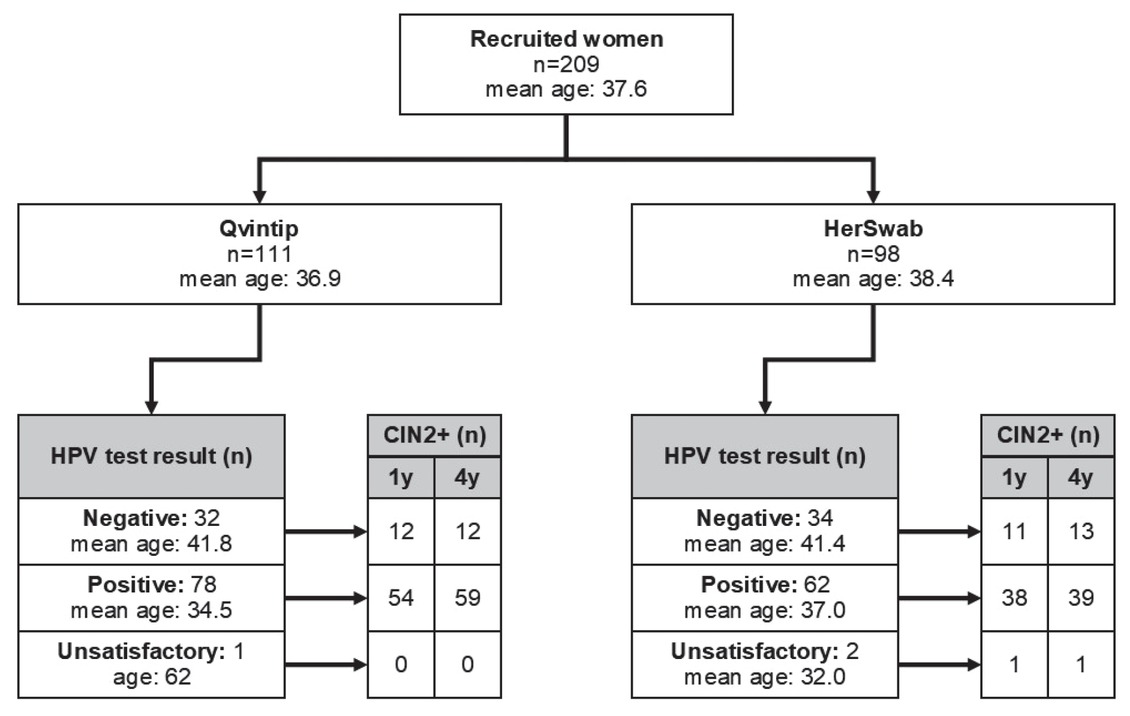
Figure 1
Flow chart of women enrolled in the study with results of human papillomaviruses (HPV) self-sampling and histological cervical intraepithelial neoplasia grade 2 or more (CIN2+) results after one and four-year follow-up.
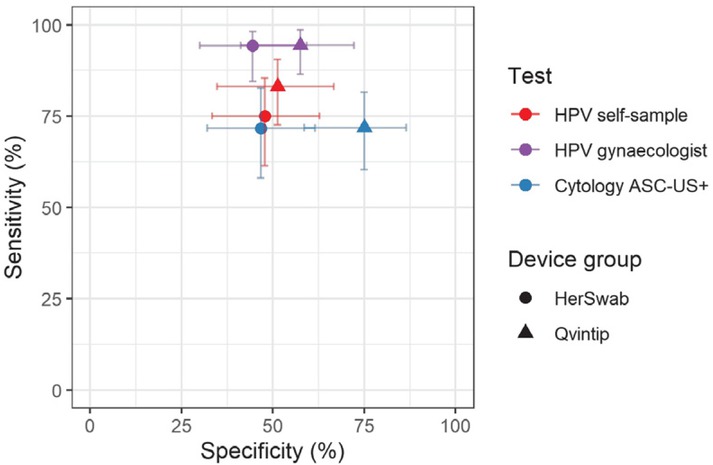
Figure 2
Sensitivity and specificity for cervical intraepithelial neoplasia grade 2 or more (CIN2+) by test (cytology, human papillomaviruses [HPV]), testing modality (self, clinician) and self-sampling device (Qvintip, HerSwab) after four years of follow-up following enrolment.
ASC-US+ = atypical squamous cells of undetermined significance or more
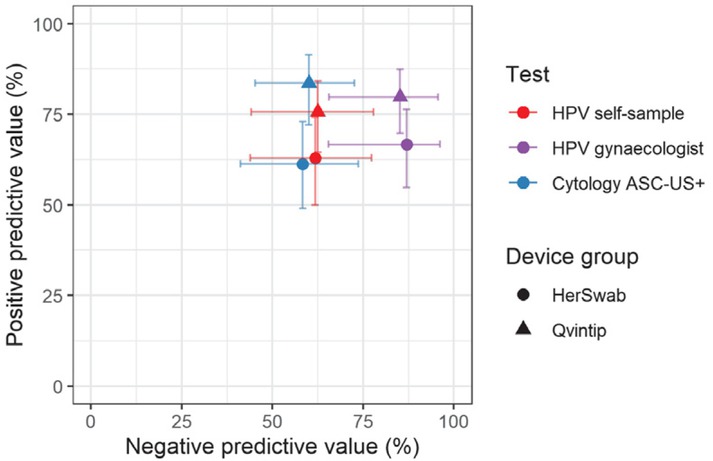
Figure 3
Positive predictive value and negative predictive value for cervical intraepithelial neoplasia grade 2 or more (CIN2+) by test (cytology, human papillomaviruses [HPV]), testing modality (self, clinician) and self-sampling device (Qvintip, HerSwab).
ASC-US+ = atypical squamous cells of undetermined significance or more
Table 1
Concordance of human papillomavirus (HPV) test results (among devices) and cytology (among laboratories)
| HPV test | Cytology | |||
|---|---|---|---|---|
| OPA (%) | kappa (95% CI) | OPAa (%) | kappa (95% CI) | |
| Qvintip group | 81.8 | 0.534 (0.349–0.718) | 74.8 | 0.471 (0.3029–0.641) |
| HerSwab group | 77.1 | 0.456 (0.2569–0.655) | 74.5 | 0.406 (0.2059–0.607) |
| Total | 79.6 | 0.495 (0.3599–0.632) | 74.6 | 0.444 (0.3159–0.574) |
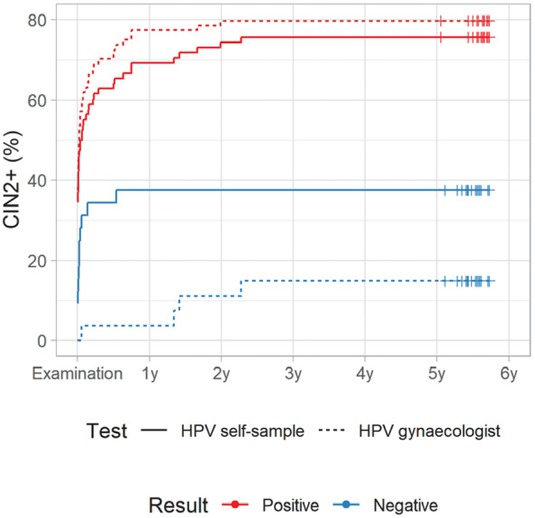
Figure 4A
Cumulative incidence of cervical intraepithelial neoplasia grade 2 or more (CIN2+) according to human papillomaviruses (HPV) test result in Qvintip group
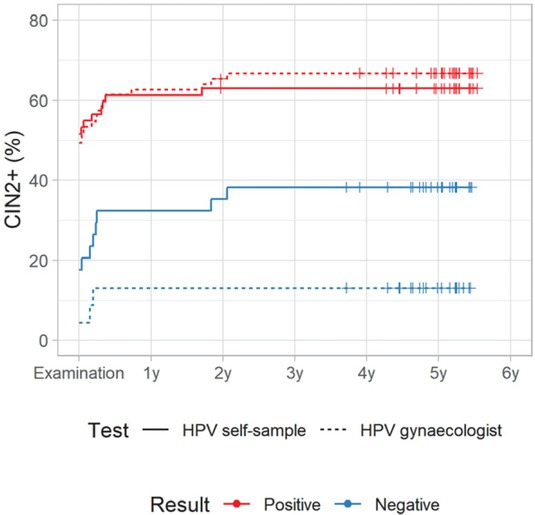
Figure 4B
Cumulative incidence of cervical intraepithelial neoplasia grade 2 or more (CIN2+) according to human papillomaviruses (HPV) test result in HerSwab group.