
Table 1
Patient characteristics
| Characteristic | LADC ( N = 194 ) | LSCC ( N = 85 ) | ||||||
|---|---|---|---|---|---|---|---|---|
| Total, n (%) | Non-PORT, n (%) | PORT, n (%) | P | Total, n (%) | Non-PORT, n (%) | PORT, n (%) | P | |
| Gender | 0.262 | 0.593 | ||||||
| Female | 96(49.5) | 72(47.4) | 24(57.1) | 7(8.2) | 6(9.1) | 1(5.3) | ||
| Male | 98(50.5) | 80(52.6) | 18(42.9) | 78(91.8) | 60(90.9) | 18(94.7) | ||
| Age (yr) | 0.058 | 0.814 | ||||||
| < 65 | 139(71.6) | 104(68.4) | 35(83.3) | 60(70.6) | 47(71.2) | 13(68.4) | ||
| ≥ 65 | 55(28.4) | 48(31.6) | 7(16.7) | 25(29.4) | 19(28.8) | 6(31.6) | ||
| Smoking Index | 0.199 | 0.058 | ||||||
| < 400 | 127(65.5) | 96(63.2) | 31(73.8) | 18(21.2) | 11(16.7) | 7(36.8) | ||
| ≥ 400 | 67(34.5) | 56(36.8) | 11(26.2) | 67(78.8) | 55(83.3) | 12(63.2) | ||
| Type of surgery | 0.028 | 0.211 | ||||||
| Lobectomy | 178(91.8) | 136(89.5) | 42(100) | 57(84.0) | 42(63.6) | 15(78.9) | ||
| Pneumonectomy | 16(8.2) | 16(10.5) | 0(0.0) | 28(16.0) | 24(36.4) | 4(21.1) | ||
| Pathological T stage | 0.044 | 0.167 | ||||||
| T1–2 | 166(85.6) | 126(82.9) | 40(95.2) | 56(65.9) | 46(69.7) | 10(52.6) | ||
| T3 | 28(14.4) | 26(17.1) | 2(4.8) | 29(34.1) | 20(30.3) | 9(47.4) | ||
| Type of pN2 | 0.228 | 0.989 | ||||||
| a1 | 46(23.7) | 38(25.0) | 8(19.0) | 31(36.5) | 24(36.4) | 7(36.8) | ||
| a2 | 62(32.0) | 44(28.9) | 18(42.9) | 26(30.6) | 20(30.3) | 64(31.6) | ||
| b | 86(44.3) | 70(46.1) | 16(38.1) | 28(32.9) | 22(33.3) | 6(31.6) | ||
| N of positive nodes | 0.090 | 0.581 | ||||||
| 1–3 | 87(44.8) | 73(48.0) | 14(33.3) | 45(52.9) | 36 (54.5) | 9(47.4) | ||
| ≥ 4 | 107(55.2) | 79(52.0) | 28(66.7) | 40(47.1) | 30(45.5) | 10(52.6) | ||
| PLNR | 0.060 | 0.832 | ||||||
| < 20% | 80(41.2) | 68(44.7) | 12(28.6) | 51(60.0) | 40(60.6) | 11(57.9) | ||
| ≥ 20% | 114(58.8) | 84(55.3) | 30(71.4) | 34(40.0) | 26(39.4) | 8(42.1) | ||
| N of N2 stations | 0.422 | 0.970 | ||||||
| Single | 46(23.7) | 38(25.0) | 8(19.0) | 31(36.5) | 24(36.4) | 7(36.8) | ||
| Multiple | 148(76.3) | 114(75.0) | 34(81.0) | 54(63.5) | 42(63.6) | 12(63.2) | ||
| POCT | 0.026 | 0.512 | ||||||
| No | 24(12.4) | 23(15.1) | 1(2.4) | 13(15.3) | 11(16.7) | 2(10.5) | ||
| Yes | 170(87.6) | 129(84.9) | 41(97.6) | 72(84.7) | 55(83.3) | 17(89.5) | ||
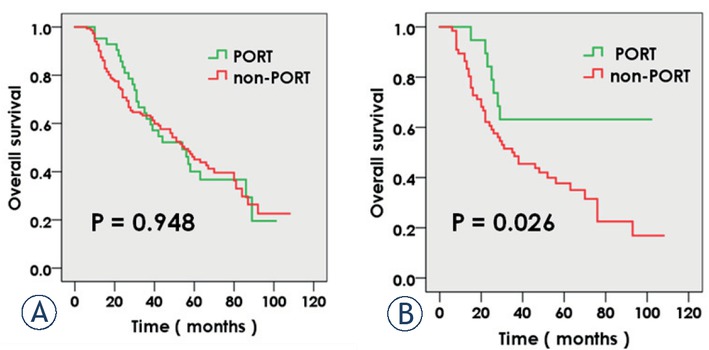
Figure 1
The survival of 194 lung adenocarcinoma (LADC) cases with or without postoperative radiotherapy (PORT). (A) Overall survival (OS) of PORT and non-PORT patients. (B) OS of 85 lung squamous cell carcinoma (LSCC) cases with PORT or non-PORT.
Table 2
Univariate analyses of the factors affecting overall survival (OS), loco-regional recurrence-free survival (LRFS) and distant metastasis-free survival (DMFS) of lung squamous cell carcinoma (LADC) patients (N = 194)
| Characteristics | No. | OS | LRFS | DMFS | |||
|---|---|---|---|---|---|---|---|
| 5-year OS, % | P | 5-year LRFS, % | P | 5-year DMFS, % | P | ||
| Gender | 0.071 | 0.085 | 0.139 | ||||
| Female | 96 | 48.2 | 46.9 | 44.1 | |||
| Male | 98 | 39.6 | 37.1 | 30.6 | |||
| Age(yr) | 0.751 | 0.811 | 0.494 | ||||
| < 65 | 139 | 43.6 | 41.6 | 34.5 | |||
| ≥ 65 | 55 | 45.0 | 42.8 | 41.3 | |||
| Smoking Index | 0.001* | 0.001* | 0.006* | ||||
| < 400 | 127 | 50.4 | 49.4 | 44.5 | |||
| ≥ 400 | 67 | 31.0 | 27.4 | 22.7 | |||
| Types of surgery | 0.468 | 0.158 | 0.319 | ||||
| Lobectomy | 178 | 44.1 | 42.3 | 36.5 | |||
| Pneumonectomy | 16 | 41.7 | 38.5 | 37.5 | |||
| Pathologic T stage | 0.032* | 0.020* | 0.001* | ||||
| pT1–2 | 166 | 46.3 | 44.0 | 40.4 | |||
| pT3 | 28 | 29.5 | 28.0 | 15.5 | |||
| Types of pN2 | 0.001* | 0.002* | 0.000* | ||||
| a1 | 46 | 60.9 | 58.3 | 58.8 | |||
| a2 | 62 | 37.9 | 38.8 | 37.8 | |||
| b | 86 | 38.7 | 35.4 | 22.5 | |||
| N of positive nodes | 0.000* | 0.000* | 0.000* | ||||
| 1–3 | 87 | 56.6 | 54.7 | 53.4 | |||
| ≥ 4 | 107 | 33.3 | 31.4 | 20.4 | |||
| PLNR | 0.000* | 0.001* | 0.000* | ||||
| < 20% | 80 | 54.8 | 52.7 | 51.8 | |||
| ≥ 20% | 114 | 35.7 | 34.0 | 26.9 | |||
| N of N2 stations | 0.001* | 0.002* | 0.001* | ||||
| Single | 46 | 60.9 | 58.3 | 58.8 | |||
| Multiple | 148 | 38.3 | 36.9 | 29.0 | |||
| POCT | 0.169 | 0.280 | 0.541 | ||||
| No | 24 | 34.4 | 36.5 | 37.5 | |||
| Yes | 170 | 44.9 | 43.0 | 36.6 | |||
| PORT | 0.948 | 0.723 | 0.440 | ||||
| No | 152 | 45.0 | 43.0 | 38.8 | |||
| Yes | 42 | 40.0 | 40.0 | 28.7 | |||
[i] Kaplan-Meier method was used to calculate 5-year OS, LRFS and DMFS. Log-rank tests were used to analyze differences between patient groups. A statistically significant difference was set at p < 0.05, represented by “*”.
PLNR = positive lymph nodes ratio; PORT = postoperative radiotherapy; POCT = postoperative chemotherapy
Table 3
Univariate analyses of the factors affecting overall survival (OS), loco-regional recurrence-free survival (LRFS) and distant metastasis-free survival (DMFS) of lung adenocarcinoma (LSCC) patients (N = 85)
| Characteristics | No | OS | LRFS | DMFS | |||
|---|---|---|---|---|---|---|---|
| 5-year OS, % | P | 5-year LRFS, % | P | 5-year DMFS, % | P | ||
| Gender | 0.670 | 0.784 | 0.762 | ||||
| Female | 7 | 42.9 | 42.9 | 42.9 | |||
| Male | 78 | 43.2 | 39.1 | 41.3 | |||
| Age(yr) | 0.362 | 0.617 | 0.447 | ||||
| < 65 | 60 | 46.4 | 40.8 | 43.9 | |||
| ≥ 65 | 25 | 36.0 | 36.0 | 36.0 | |||
| Smoking Index | 0.713 | 0.659 | 0.767 | ||||
| < 400 | 18 | 55.6 | 44.4 | 50.0 | |||
| ≥ 400 | 67 | 39.6 | 37.8 | 39.0 | |||
| Type of surgery | 0.283 | 0.375 | 0.498 | ||||
| Lobectomy | 57 | 47.6 | 42.4 | 45.5 | |||
| Pneumonectomy | 28 | 34.1 | 33.2 | 33.9 | |||
| Pathologic T stage | 0.341 | 0.289 | 0.237 | ||||
| pT1–2 | 56 | 46.4 | 44.1 | 47.1 | |||
| pT3 | 29 | 37.0 | 30.3 | 31.8 | |||
| Type of N2 | 0.625 | 0.596 | 0.882 | ||||
| a1 | 31 | 50.6 | 44.4 | 44.8 | |||
| a2 | 26 | 41.3 | 37.8 | 41.2 | |||
| b | 28 | 35.2 | 34.3 | 38.1 | |||
| N of positive nodes | 0.115 | 0.161 | 0.431 | ||||
| 1–3 | 45 | 49.2 | 45.2 | 46.1 | |||
| ≥ 4 | 40 | 36.7 | 34.1 | 36.1 | |||
| PLNR | 0.152 | 0.154 | 0.265 | ||||
| < 20% | 51 | 48.7 | 43.8 | 46.9 | |||
| ≥ 20% | 34 | 34.4 | 33.0 | 33.1 | |||
| N2 stations | 0.367 | 0.363 | 0.654 | ||||
| Single | 31 | 50.6 | 44.4 | 44.8 | |||
| Multiple | 54 | 38.9 | 36.9 | 39.7 | |||
| POCT | 0.316 | 0.371 | 0.525 | ||||
| No | 13 | 30.8 | 30.8 | 30.8 | |||
| Yes | 72 | 45.3 | 40.9 | 43.5 | |||
| PORT | 0.026* | 0.008** | 0.018* | ||||
| No | 66 | 37.7 | 32.5 | 35.3 | |||
| Yes | 19 | 63.2 | 63.2 | 63.2 | |||
[i] Kaplan-Meier method was used to calculate 5-year OS, LRFS and DMFS. Log-rank tests were used to analyze differences between patient groups. A statistically significant difference was set at p < 0.05, represented by “*”.
PLNR = positive lymph nodes ratio; PORT = postoperative radiotherapy; POCT = postoperative chemotherapy
Table 4
Multivariate analyses of the factors affecting overall survival (OS), loco-regional recurrence-free survival (LRFS) and distant metastasis-free survival (DMFS) of lung squamous cell carcinoma (LADC) patients (N = 194)
| Characteristics | OS | LRFS | DMFS | |||
|---|---|---|---|---|---|---|
| HR (95% CI) | P | HR(95% CI) | P | HR (95% CI) | P | |
| Smoking Index | 0.000* | 0.000* | 0.005* | |||
| < 400 | 1 | 1 | 1 | |||
| ≥ 400 | 2.172(1.471–3.207) | 2.098(1.421–3.099) | 1.739(1.181–2.560) | |||
| Pathologic T stage | 0.074 | 0.156 | 0.002* | |||
| pT1–2 | 1 | 1 | 1 | |||
| pT3 | 1.560(0.958–2.542) | 1.428(0.873–2.337) | 2.120(1.308–3.435) | |||
| N of positive nodes | 0.255 | 0.234 | 0.134 | |||
| 1–3 | 1 | 1 | 1 | |||
| ≥ 4 | 1.403(0.783–2.512) | 1.441(0.789–2.632) | 1.624(0.861–3.062) | |||
| PLNR | 0.392 | 0.435 | 0.471 | |||
| < 20% | 1 | 1 | 1 | |||
| ≥ 20% | 1.313(0.704–2.447) | 1.291(0.680–2.452) | 1.283(0.651–2.528) | |||
| N of N2 stations | 0.015* | 0.046* | 0.141 | |||
| Single | 1 | 1 | 1 | |||
| Multiple | 2.065(1.148–3.714) | 1.818(1.010–3.272) | 1.565(0.863–2.839) | |||
| POCT | 0.004* | 0.031* | 0.047* | |||
| No | 1 | 1 | 1 | |||
| Yes | 0.417(0.230–0.757) | 0.524(0.291–0.942) | 0.554(0.310–0.992) | |||
| PORT | 0.759 | 0.737 | 0.444 | |||
| No | 1 | 1 | 1 | |||
| Yes | 1.074(0.680–1.697) | 0.924(0.584–1.463) | 1.196(0.756–1.891) | |||
[i] Multivariable Cox proportional hazard models were used to adjust risk factor distributions between patient groups. A statistically significant difference was set as p < 0.05, represented by “*”.
PLNR = positive lymph nodes ratio; PORT = postoperative radiotherapy; POCT = postoperative chemotherapy; HR = hazard ratio; CI = confidence interval
Table 5
Multivariate analyses of the factors affecting overall survival (OS), loco-regional recurrence-free survival (LRFS) and distant metastasis-free survival (DMFS) of lung adenocarcinoma (LSCC) patients (N = 85)
| Characteristics | OS | LRFS | DMFS | |||
|---|---|---|---|---|---|---|
| HR (95% CI) | P | HR(95% CI) | P | HR (95% CI) | P | |
| Smoking Index | 0.789 | 0.823 | 0.563 | |||
| < 400 | 1 | 1 | 1 | |||
| ≥ 400 | 0.905(0.436–1.880) | 0.922(0.454–1.874) | 0.806(0.389–1.672) | |||
| Pathologic T stage | 0.208 | 0.149 | 0.151 | |||
| pT1–2 | 1 | 1 | 1 | |||
| pT3 | 1.436(0.817–2.522) | 1.524(0.860–2.701) | 1.522(0.858–2.699) | |||
| N of positive nodes | 0.257 | 0.296 | 0.664 | |||
| 1–3 | 1 | 1 | 1 | |||
| ≥ 4 | 1.618(0.704–3.715) | 1.556(0.679–3.563) | 1.194(0.537–2.657) | |||
| PLNR | 0.440 | 0.454 | 0.330 | |||
| < 20% | 1 | 1 | 1 | |||
| ≥ 20% | 1.322(0.650–2.689) | 1.308(0.648–2.643) | 1.428(0.697–2.925) | |||
| N of N2 stations | 0.922 | 0.963 | 0.813 | |||
| Single | 1 | 1 | 1 | |||
| Multiple | 1.043(0.447–2.436) | 0.979(0.409–2.343) | 0.903(0.385–2.114) | |||
| POCT | 0.127 | 0.224 | 0.496 | |||
| No | 1 | 1 | 1 | |||
| Yes | 0.523(0.227–1.202) | 0.595(0.258–1.374) | 0.751(0.328–1.715) | |||
| PORT | 0.017* | 0.006* | 0.013* | |||
| No | 1 | 1 | 1 | |||
| Yes | 0.364(0.159–1.832) | 0.308(0.133–0.712) | 0.349(0.152–0.802) | |||
[i] Multivariable Cox proportional hazard models were used to adjust risk factor distributions between patient groups. A statistically significant difference was set at p < 0.05, represented by “*”.
PLNR = positive lymph nodes ratio; PORT = postoperative radiotherapy; POCT = postoperative chemotherapy; HR = hazard ratio; CI = confidence interval
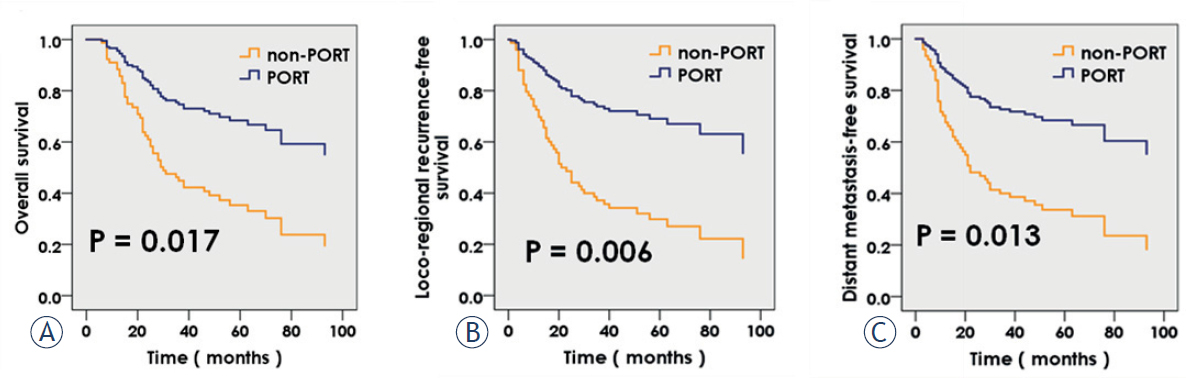
Figure 2
The effect of postoperative radiotherapy (PORT) on the survival of 85 lung squamous cell carcinoma (LSCC) patients. (A) Overall survival (OS). (B) loco-regional recurrence-free survival (LRFS). (C) Distant metastasis-free survival (DMFS). PORT alone was a significant positive prognostic factor for OS (p = 0.017) (A); LRFS (p = 0.006 (B); and DMFS (p = 0.013) (C).