Figure 1
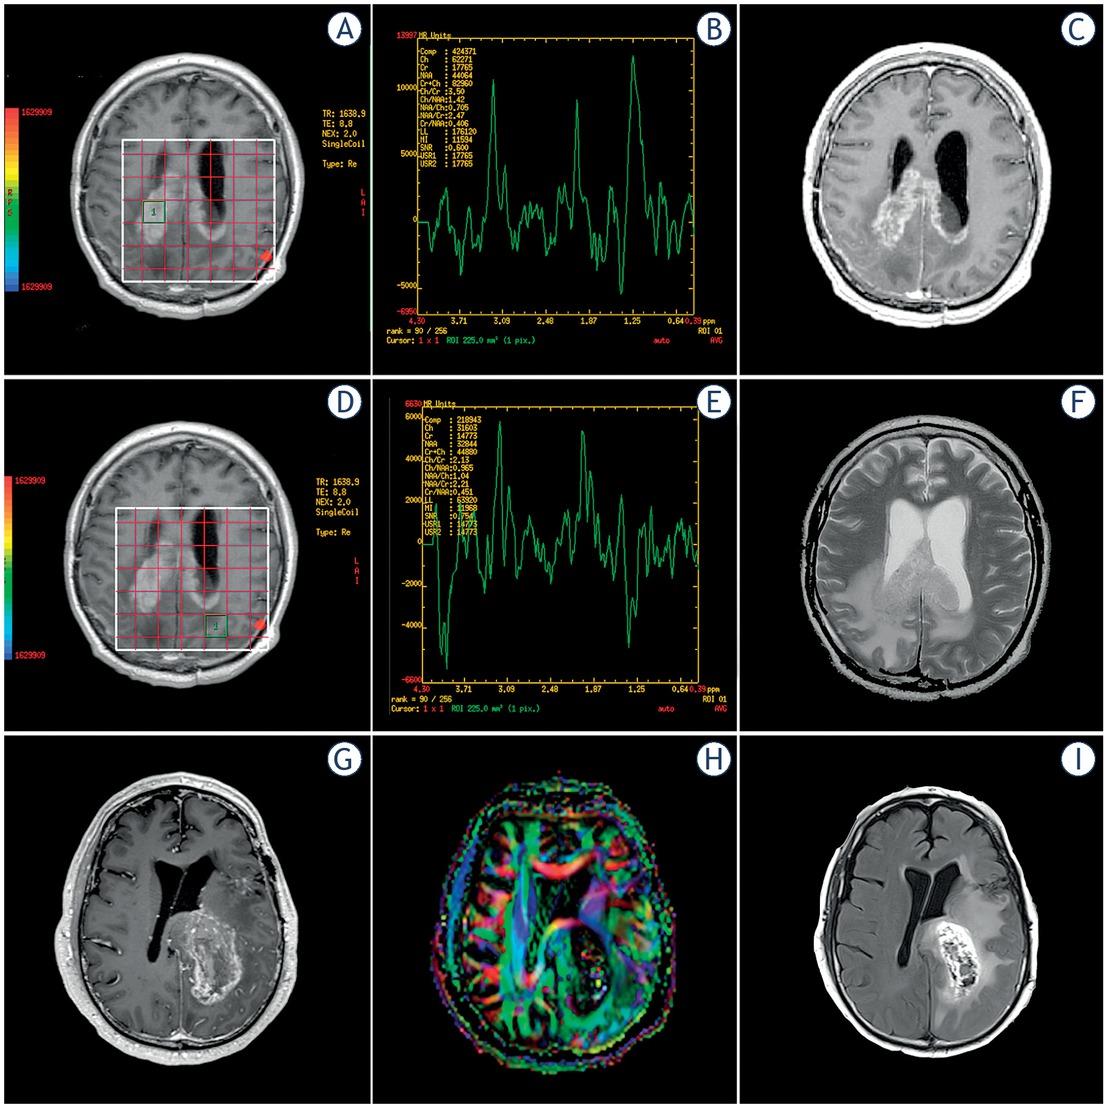
Figure 2
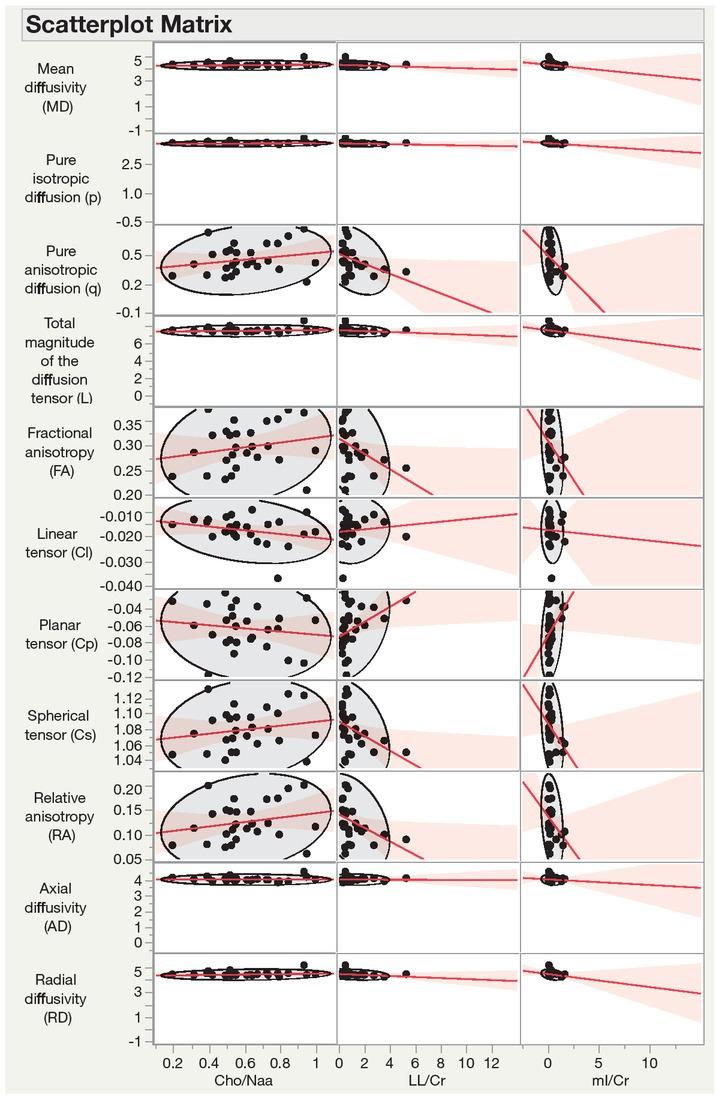
Figure 3
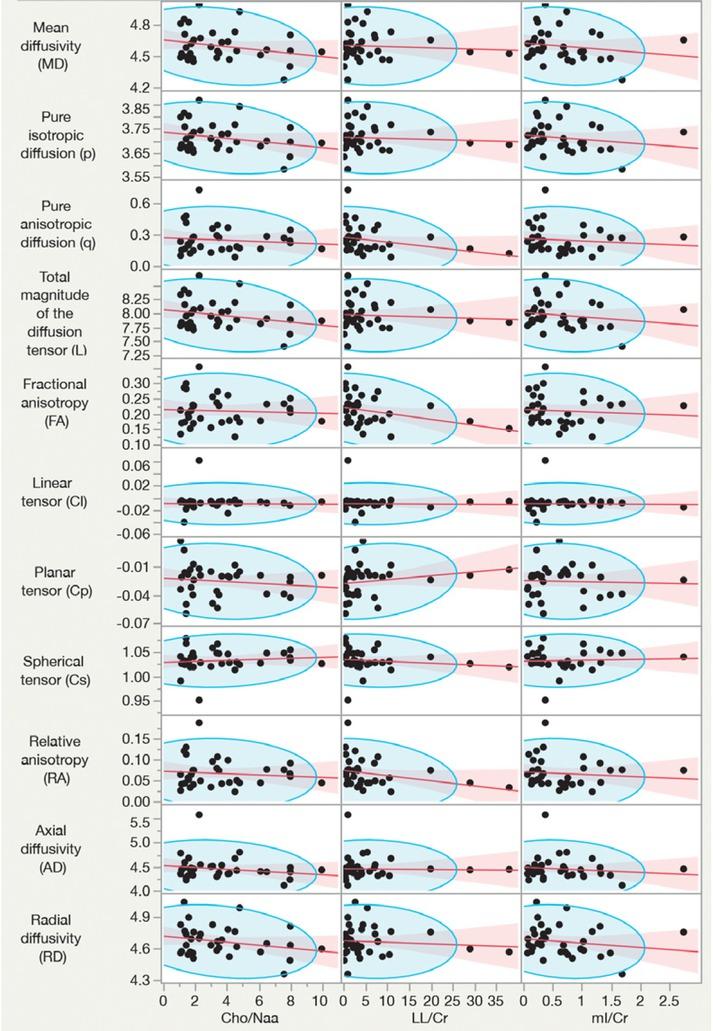
Figure 4
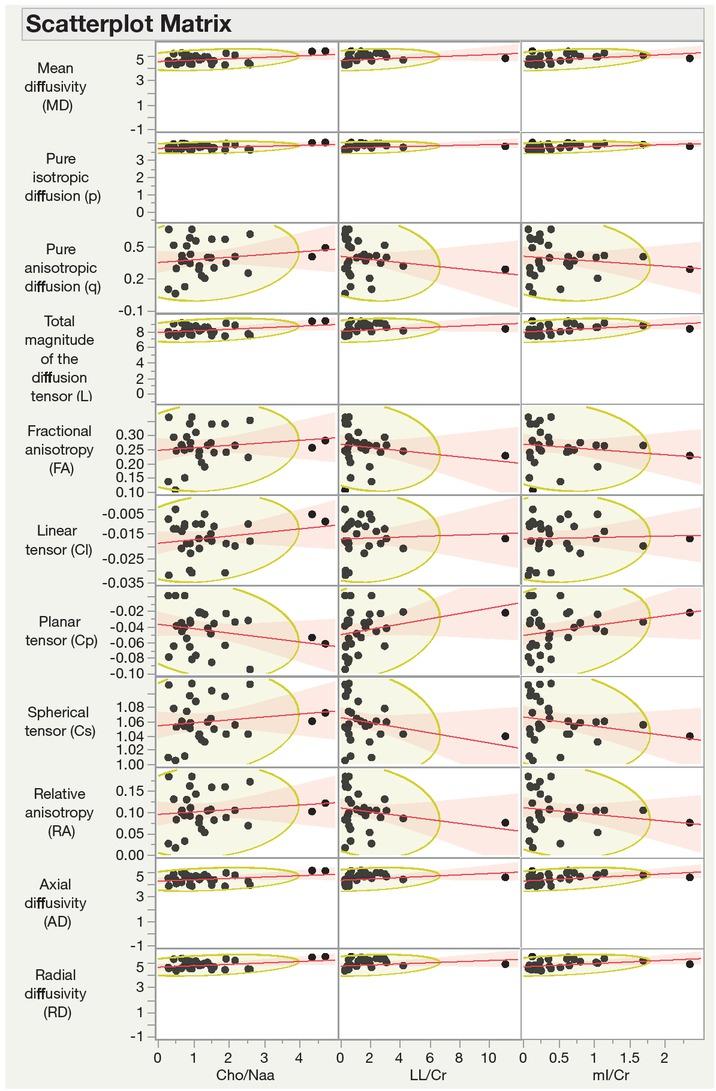
Figure 5

© 2020 Eduardo Flores-Alvarez, Edgar Anselmo Rios Piedra, Griselda-Adriana Cruz-Priego, Coral Durand-Muñoz, Sergio Moreno-Jimenez, Ernesto Roldan-Valadez, published by Association of Radiology and Oncology
This work is licensed under the Creative Commons Attribution-NonCommercial-NoDerivatives 3.0 License.