
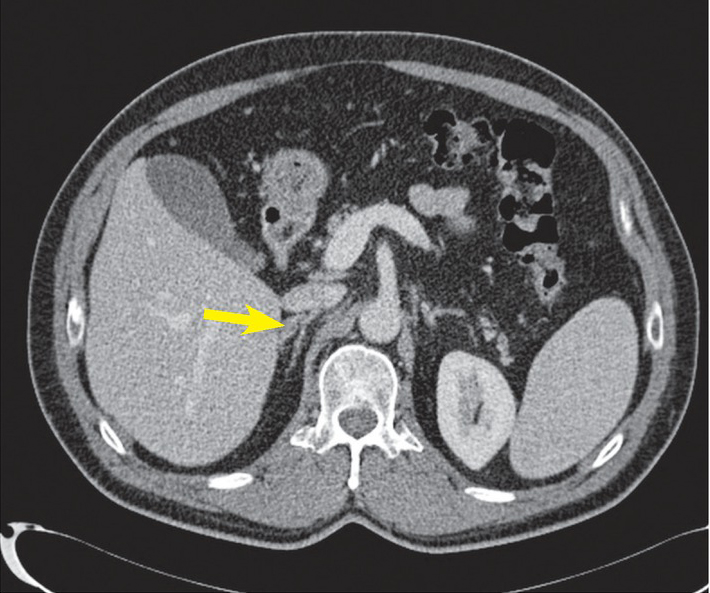
Figure 1
Tiny aldosterone-producing adenoma (8 mm) in lateral limb of the right adrenal gland (arrow) (CT scan).
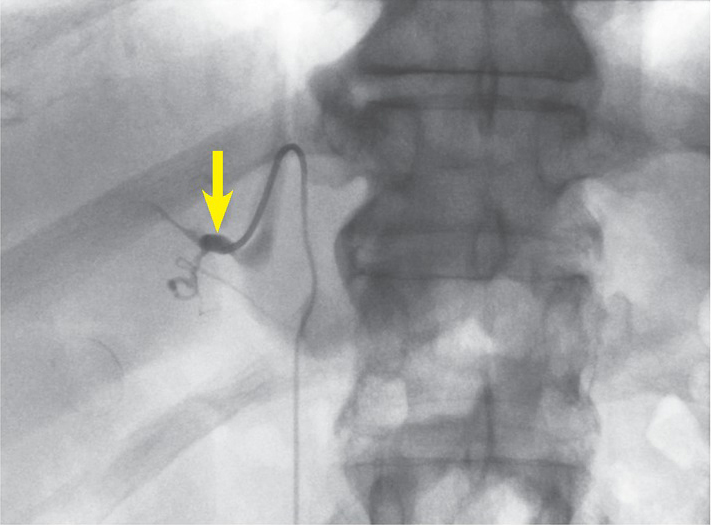
Figure 2
The right adrenal vein during sampling (arrow) (angiography).
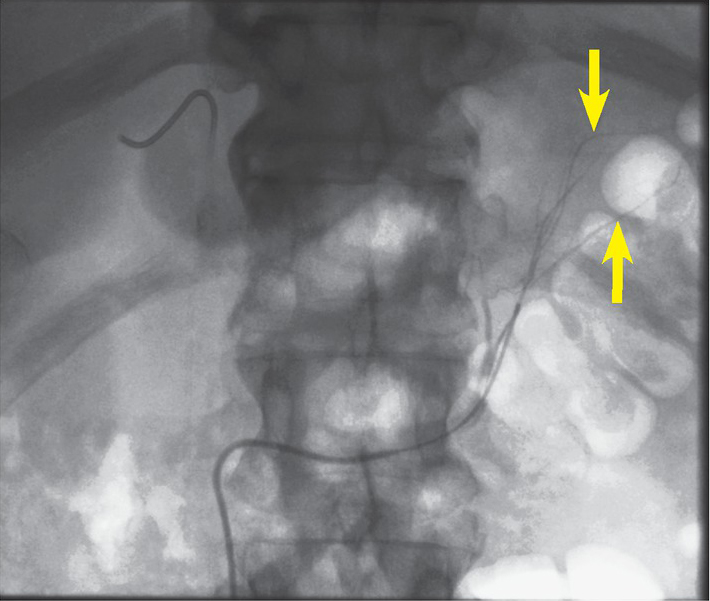
Figure 3
Branches of the left adrenal vein during sampling (arrows) (angiography).
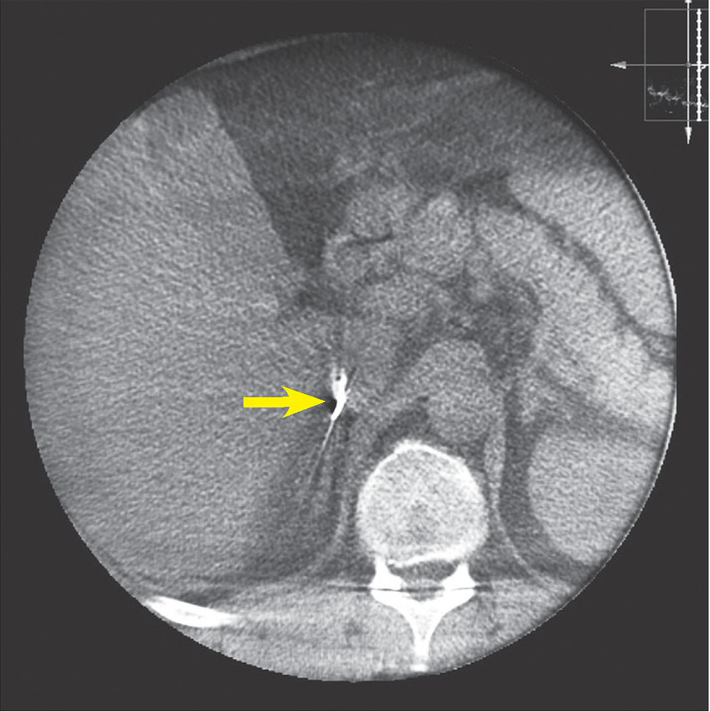
Figure 4
Tip of the catheter in the right adrenal vein (arrow); both limbs of the right adrenal gland are visible underneath (cone beam CT).
Table 1
Clinical characteristics and laboratory parameters of the patients
| Characteristic | Descriptive statistics |
|---|---|
| n | 235 |
| Male patients | 168 (71%) |
| Age (years) | 56 (32–73) |
| Body Mass Index (kg/m2) | 30.4 (18.3–48.4) |
| Systolic BP at presentation (mm Hg) | 155 (145–170) |
| Diastolic BP at presentation (mm Hg) | 90 (80–95) |
| Number of antihypertensive agents | 3 (2–4) |
| Hypokalemia | 172 (73%) |
| eGFR (ml/min/1.73 m2) | 88 (71–102) |
| Baseline aldosterone (nmol/L) | 0.7 (0.3–8.8) |
| Baseline PRA (ng/mL/h) | 0.2 (0.2–0.9) |
| Baseline ARR | 4.2 (1.1–43.8) |
| CT* normal / bilateral / unilateral | 66 (28%) / 24 (10%) / 144 (62%) |
| Tumor size on CT (mm) | 13 (8–19) |
* = not performed in one patient; ARR = serum aldosterone-to-renin ratio; BP = blood pressure; eGFR = estimated glomerular filtration rate; PRA = plasma renin activity; Descriptive statistics are reported as median (interquartile range) for numeric variables and number (percentage) for categorical variables;
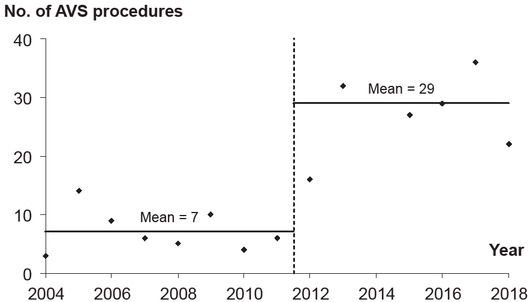
Figure 5
Number of adrenal vein sampling procedures per year during the study period.
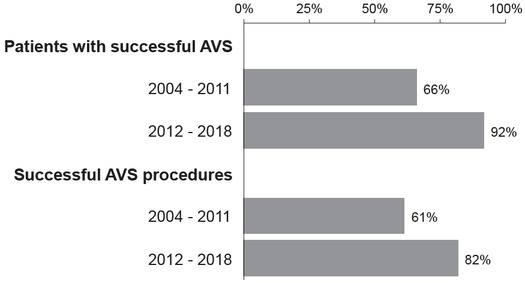
Figure 6
Patients with successful adrenal vein sampling (AVS) and successful AVS procedures during the study period.
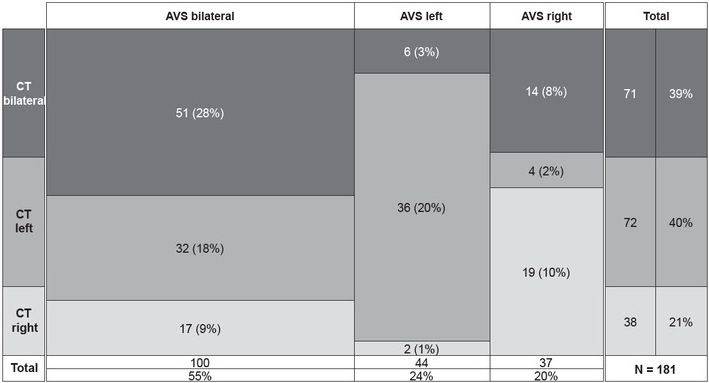
Figure 7
Agreement between adrenal vein sampling (AVS) and CT findings depicted with a variable-width stacked column chart. Patients with normal CT scans are included in the CT bilateral category