
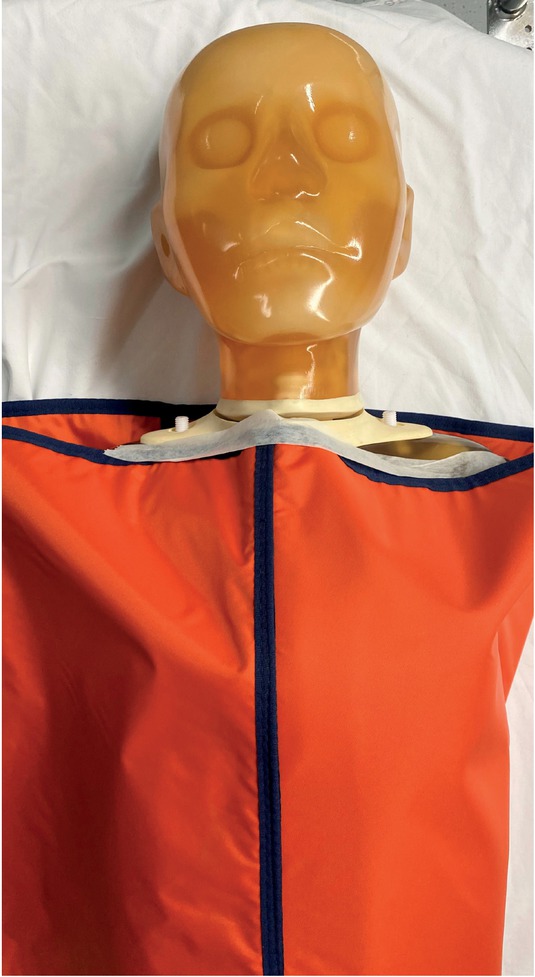
Figure 1
Presentation of the shielding position used in the study.
Table 2
Mean measured skin dose to the breasts in both investigated hospitals
| Hospital A | Hospital B | |||
|---|---|---|---|---|
| unshielded | shielded | unshielded | shielded | |
| Mean skin dose to breast (μGy) | 338.2 ± 43.7 | 64.3 ± 18.8 | 253.1 ± 35.1 | 65.3 ± 16.9 |
| Dose reduction | 81% | 74% | ||
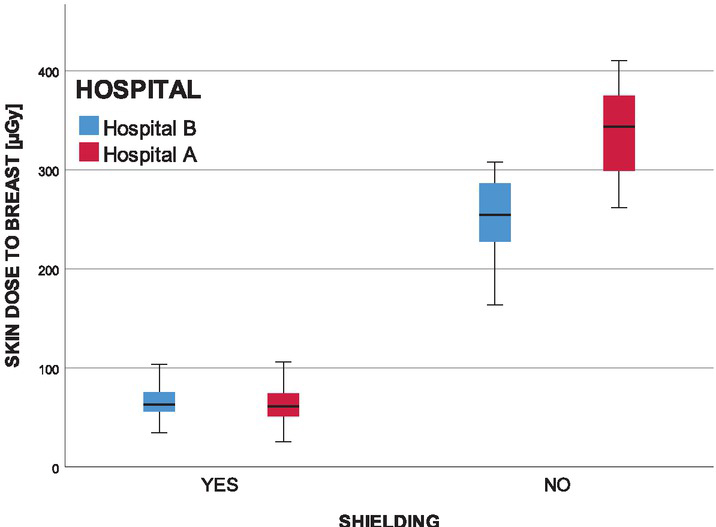
Figure 2
Mean skin dose to breast in both hospitals with and without the shielding.