
Figure 1
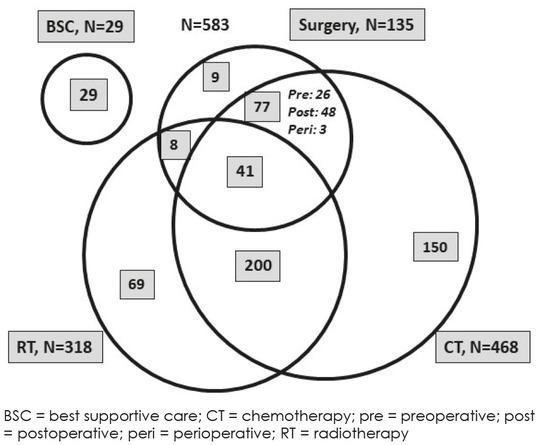
Figure 2
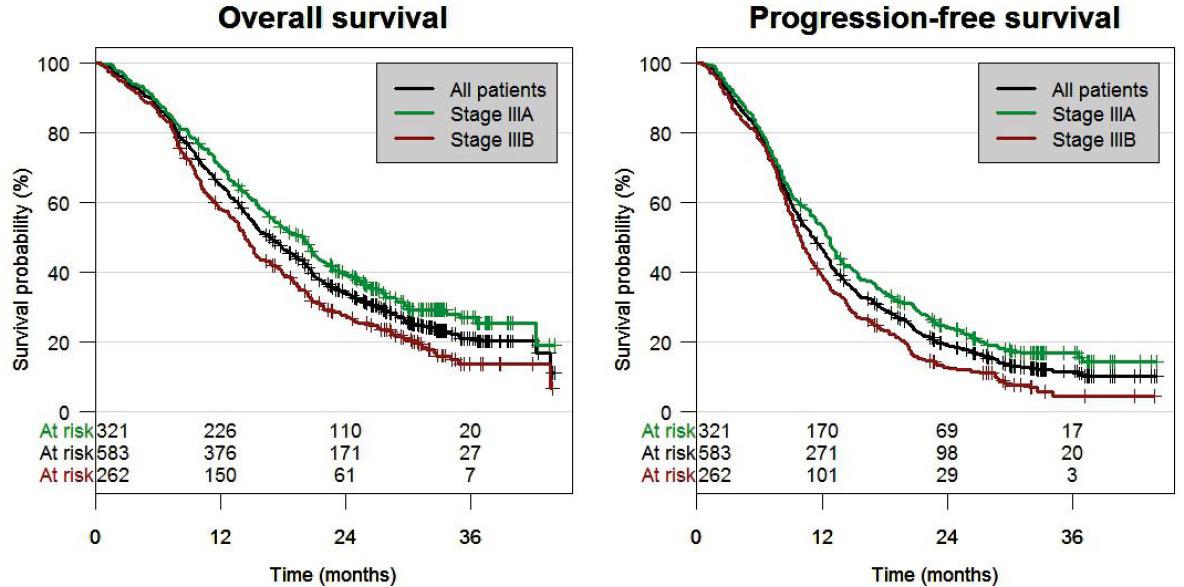
Figure 3
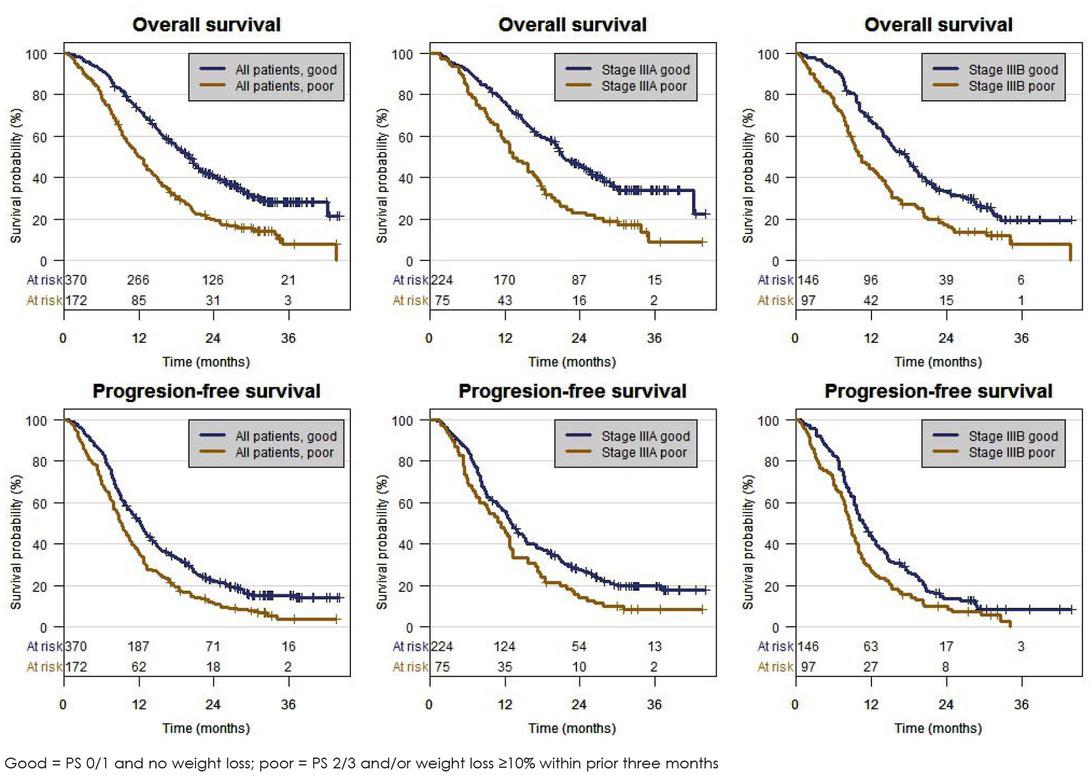
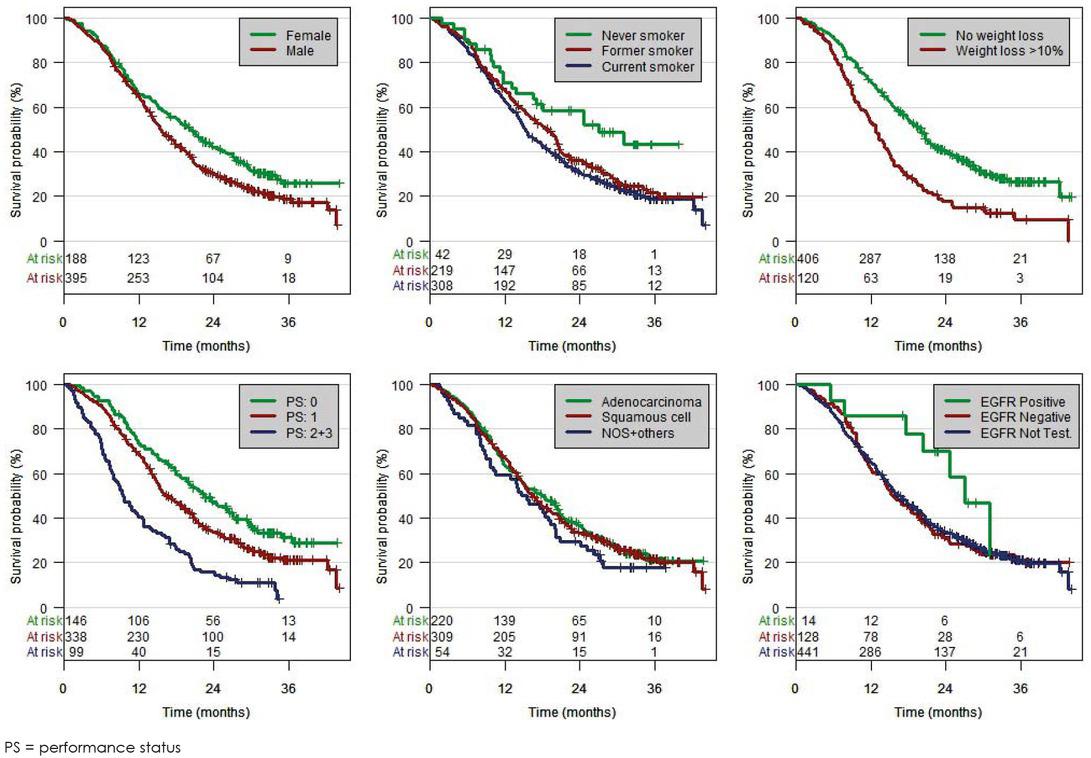
Figure 4
Diagnostic procedures
| Patients(N = 583) | ||
|---|---|---|
| Procedure | ||
| N (%) | range of % in centres | |
| Chest CT scan | 567 (97) | 67 – 100 |
| Chest X-ray | 559 (96) | 79 – 100 |
| Bronchoscopy | 521 (89) | 65 – 100 |
| Upper abdominal CT scan | 389 (67) | 0 – 100 |
| Upper abdominal US | 160 (27) | 2 – 87 |
| PET-CT or PET scan | 163 (28) | 0 – 78 |
| Brain CT or MRI | 117 (20) | 0 – 91 |
| Bone scan | 88 (15) | 0 – 79 |
| EBUS or EUS | 80 (14) | 0 – 71 |
| CT-guided biopsy | 54 (9) | 0 – 31 |
| VATS | 19 (3) | 0 – 35 |
| Mediastinoscopy | 13 (2) | 0 – 13 |
| Others | 47 (8) | 0 – 30 |
Overall survival according to stage and treatment modalities
| N | Median | 1-year | 2-year | 3-year | |
|---|---|---|---|---|---|
| Characteristic | |||||
| Months (95% CI) | % (95% CI) | ||||
| IIIA | |||||
| Total* | 321 | 20.0 (17.1; 21.4) | 70.7 (65.9; 75.9) | 39.4 (34.3; 45.2) | 27.0 (21.8; 33.3) |
| Good | 223 | 21.4 (20.1; 25.8) | 76.3 (70.9; 82.1) | 45.6 (39.4; 52.8) | 33.8 (27.7; 41.3) |
| Poor | 75 | 13.3 (11.4; 17.7) | 57.3 (47.2; 69.7 | 23.2 (15.2; 35.2) | 9.1 (3.2; 26.0) |
| IIIB | |||||
| Total* | 262 | 14.4 (13.0; 15.9) | 58.2 (52.3; 64.5) | 27.5 (22.5; 33.7) | 13.5 (9.0; 20.2) |
| Good | 146 | 17.8 (14.8; 19.6) | 67.0 (59.8; 75.1) | 33.1 (26.1; 42.0) | 19.6 (13.2; 29.1) |
| Poor | 97 | 10.4 (8.8; 19.6) | 44.1 (35.2; 55.2) | 17.3 (11.1; 27.0) | 8.1 (3.0; 21.6) |
| T3N3 and T4N3** | 84 | 11.6 (9.8; 15.9) | 48.5 (38.8; 60.5) | 22.6 (15.2; 33.8) | 9.4 (3.9; 22.7) |
| IIIA+IIIB | |||||
| Total* | 583 | 16.8 (15.3; 18.5) | 65.1 (61.3; 69.1) | 34.1 (30.4; 38.2) | 21.0 (17.3; 25.4) |
| Good | 369 | 20.1 (18.0; 21.5) | 72.6 (68.2; 77.3) | 40.7 (35.9; 46.2) | 28.3 (23.6; 34.0) |
| Poor | 172 | 11.8 (10.2; 14.2) | 50.0 (42.9; 57.9) | 19.9 (14.6; 27.0) | 8.0 (3.6; 17.8) |
| Surgery | |||||
| All surgeries | 135 | 29.0 (27.1; NA) | 82.2 (76.0; 88.9) | 60.6 (52.8; 69.6) | 43.9 (35.2; 54.8) |
| Alone | 9 | 13.9 (3.2; NA) | 55.6 (31.0; 99.7) | 22.2 (6.6; 75.4) | 22.2 (6.6; 75.4) |
| Surgery plus CT or RT | 85 | 27.8 (23.6; NA) | 80.0 (71.9; 89.0) | 57.2 (47.5; 68.9) | 37.0 (26.7; 51.3) |
| Surgery plus adjuvant CT | 77 | 28.3 (24.7; NA) | 81.8 (73.6; 90.9) | 60.6 (50.6; 72.7) | 38.9 (28.0; 54.0) |
| Trimodality therapy | 41 | Not reached | 92.7 (85.0; 100) | 76.9 (64.7; 91.5) | 64.8 (49.9; 84.2) |
| Non-surgical therapy | |||||
| All non-surgical | 448 | 14.6 (13.7; 15.9) | 59.9 (55.5; 64.7) | 26.0 (22.1; 30.5) | 13.8 (10.2; 18.8) |
| CT alone | 150 | 12.7 (11.3; 13.9) | 56.5 (49.1; 65.0) | 19.1 (13.7; 26.8) | 6.2 (2.7; 14.4) |
| RT alone | 69 | 12.7 (9.6; 18.4) | 52.2 (41.6; 65.4) | 18.8 (11.6; 30.7) | 11.8 (5.9; 23.5) |
| CRT all | 200 | 19.6 (17.5; 21.6) | 72.9 (67.0; 79.3) | 36.9 (30.7; 44.5) | 22.6 (16.1; 31.6) |
| CRT sequential | 146 | 20.5 (17.2; 22.8) | 75.2 (68.5; 82.5) | 38.8 (31.5; 47.9) | 23.5 (16.2; 34.0) |
| CRT concurrent | 54 | 17.9 (14.6; 22.2) | 66.7 (55.2; 80.5) | 32.0 (21.6; 47.6) | 22.5 (12.7; 39.9) |
| HR (95% CI) | p-value | ||||
| IIIA vs. IIIB | 0.70 (0.58; 0.85) | < 0.001 | |||
| IIIA Good vs. IIIA Poor | 0.54 (0.40; 0.73) | < 0.001 | |||
| IIIB Good vs. IIIB Poor | 0.57 (0.43; 0.76) | < 0.001 | |||
| IIIA vs. IIIB Good | 0.86 (0.68; 1.09) | 0.212 | |||
| Tri-modality vs. Surgery plus adjuvant CT | 0.47 (0.25; 0.89) | 0.021 | |||
| CRT sequential vs. concurrent | 0.83 (0.57; 1.20) | 0.326 | |||
TNM subgroups (Union for International Cancer Control [UICC] 7)
| Total patient population | Patients undergoing surgery | |||
|---|---|---|---|---|
| TNM | ||||
| N (%) | N | % of total population | % in stage subgroup | |
| IIIA+IIIB | 583 (100) | 135 | 32.2 | NA |
| IIIA | 321 (55.1) | 119 | 20.4 | 37.1 |
| T4N0 | 33 (5.7) | 10 | 1.7 | 30.3 |
| T3N1 | 39 (6.7) | 16 | 2.7 | 41.0 |
| T4N1 | 26 (4.5) | 7 | 1.2 | 26.9 |
| T1N2 | 25 (4.3) | 14 | 2.4 | 56.0 |
| T2N2 | 98 (16.8) | 45 | 7.7 | 45.9 |
| T3N2 | 100 (17.2) | 27 | 4.6 | 27.0 |
| IIIB | 262 (44.9) | 16 | 2.8 | 6.1 |
| T4N2 | 129 (22.2) | 15 | 2.6 | 11.6 |
| T1N3 | 17 (2.9) | 0 | 0 | |
| T2N3 | 32 (5.5) | 0.2 | 3.1 | |
| T3N3 | 29 (5.0) | |||
| T4N3 | 55 (9.4) | |||
| T stage | ||||
| T1 | 42 (7.2) | 14 | 2.4 | 33.3 |
| T2 | 130 (22.3) | 46 | 7.9 | 35.4 |
| T3 | 168 (28.8) | 43 | 7.4 | 25.6 |
| T4 | 243 (41.7) | 32 | 5.5 | 13.1 |
| N stage | ||||
| N0 | 33 (5.7) | 10 | 1.7 | 30.3 |
| N1 | 65 (11.1) | 23 | 3.9 | 35.4 |
| N2 | 352 (60.4) | 101 | 17.3 | 28.7 |
| N3 | 133 (22.8) | 1 | 0.2 | 0.8 |
Therapeutic modalities and combinations
| Therapeutic modalities | IIIA (N=321) | IIIB (N 262) N=(%) | IIIA+IIIB (N=583) |
|---|---|---|---|
| Any combination | 207 (64.5) | 119 (45.4) | 326 (55.9) |
| Surgery | 119 (37.1) | 16 (6.1) | 135 (23.2) |
| Surgery alone | 9 (2.8) | 0 | 9 (1.5) |
| Surgery plus radiotherapy | 7 (2.2) | 1 (0.4) | 8 (1.4) |
| Surgery plus chemotherapy | 70 (21.8) | 7 (2.7) | 77 (13.2) |
| Preoperative chemotherapy | 22 (6.9) | 4 (1.5) | 26 (4.4) |
| Perioperative chemotherapy | 3 (0.9) | 0 | 3 (0.5) |
| Adjuvant chemotherapy | 45 (14.0) | 3 (1.1) | 48 (8.2) |
| Surgery plus RT plus CT (trimodality) | 33 (10.3) | 8 (3.1) | 41 (7.0) |
| Sequential preoperative RT plus CT | 2 (0.6) | 0 | 2 (0.3) |
| Concurrent preoperative RT plus CT | 3 (0.9) | 1 (0.4) | 4 (0.7) |
| Sequential postoperative RT plus CT | 23 (7.2) | 3 (1.1) | 26 (4.5) |
| Concurrent postoperative RT plus CT | 5 (1.6) | 4 (1.5) | 9 (1.5) |
| Thoracic RT (including other modalities) | 174 (54.2) | 144 (55.0) | 318 (54.6) |
| Radiotherapy alone | 37 (11.5) | 32 (12.2) | 69 (11.8) |
| Chemoradiotherapy | 97 (30.2) | 103 (39.3) | 200 (34.3) |
| Sequential | 74 (23.1) | 72 (27.5) | 146 (25.0) |
| Concurrent | 23 (7.2) | 31 (11.8) | 54 (9.3) |
| Chemotherapy (including other modalities) | 256 (79.7) | 212 (80.9) | 468 (80.3) |
| Chemotherapy alone | 58 (18.1) | 92 (35.1) | 150 (25.7) |
| Best supportive care alone | 9 (2.8) | 20 (7.6) | 29 (5.0) |
| Type of surgery | IIIA (N = 119) | IIIB (N = 16) | IIIA+IIIB (N = 135) |
| Lobectomy | 74 (62.3) | 3 (18.7) | 77 (57.0) |
| Bi-lobectomy | 6 (5.0) | 0 | 6 (4.5) |
| Pneumonectomy | 28 (23.5) | 4 (25.0) | 32 (23.7) |
| Atypical radical resection | 5 (4.2) | 1 (6.2) | 6 (4.5) |
| Non-radical surgery* | 6 (5.0) | 8 (50.0) | 14 (10.4) |
Progression free survival according to stage and risk groups
| Progression-free survival | |||||
|---|---|---|---|---|---|
| Characteristic | N | Median | 1-year | 2-year | 3-year |
| Months (95% CI) | % (95% CI) | ||||
| IIIA | |||||
| Total* | 321 | 12.5 (11.3; 13.6) | 52.9 (47.7; 58.7) | 24.1 (19.8; 29.3) | 16.8 (13.0; 21.7) |
| Good | 223 | 12.9 (12; 15.2) | 55.8 (49.6; 62.7) | 27.6 (22.3; 34.3) | 19.6 (14.8; 26.0) |
| Poor | 75 | 11.4 (7.9; 13.2) | 45.3 (35.4; 58.1) | 14.2 (8.1; 25.0) | 8.3 (3.8; 18.1) |
| IIIB | |||||
| Total* | 262 | 9.9 (9.2; 10.8) | 38.5 (33.1; 44.9) | 12.8 (9.3; 17.7) | 4.3 (1.8; 9.9) |
| Good | 146 | 10.7 (9.6; 12.6) | 43.8 (36.5; 52.6) | 13.6 (9.0; 20.8) | 8.6 (4.7; 15.5) |
| Poor | 97 | 8.6 (7.8; 9.9) | 26.8 (19.3; 37.2) | 9.9 (5.4; 18.2) | 0 |
| T3N3 and T4N3** | 84 | 9.4 (7.9; 11.3) | 34.5 (25.7; 46.3) | 10.7 (5.8; 20.0) | 2.5 (0.4; 15.1) |
| IIIA+IIIB | |||||
| Total* | 583 | 11.2 (10.2; 12.2) | 46.5 (42.6; 50.7) | 19.0 (16.0; 22.6) | 11.5 (8.9; 14.9) |
| Good | 369 | 12.2 (11.0; 13.3) | 51.0 (46.2; 56.4) | 22.1 (18.2; 26.9) | 15.4 (11.9; 19.9) |
| Poor | 172 | 9.2 (8.3; 10.5) | 34.9 (28.4; 42.8) | 11.7 (7.7; 17.7) | 3.7 (1.3; 10.8) |
| HR (95% CI) | p-value | ||||
| IIIA vs IIIB | 0.71 (0.59; 0.85) | < 0.001 | |||
| IIIA Good vs IIIA Poor | 0.69 (0.52; 0.92) | 0.011 | |||
| IIIB Good vs IIIB Poor | 0.69 (0.53; 0.90) | 0.006 | |||
| IIIA vs IIIB Good | 0.80 (0.65; 0.99) | 0.037 | |||
Overall survival according to diagnostic variables
| Survival | |||||||
|---|---|---|---|---|---|---|---|
| Median | Univariate analysis | P-value | Multivariate analysis | ||||
| Variable | N | P-value | |||||
| months (95% CI) | HR (95% Wald CI) | HR (95% Wald CI) | |||||
| Stage | IIIA | 321 | 20.0 (17.1; 21.4) | IIIA vs. IIIB: | |||
| IIIB | 262 | 14.4 (13.0; 15.9) | 0.70 (0.58; 0.85) | < 0.001 | 0.77 (0.62;0.95) | 0.017 | |
| Gender | Female | 188 | 20.4 (16.8; 23.8) | 0.76 (0.62; 0.94) | Femalevs | 0.78 (0.64;0.96) | 0.044 |
| Smoking | Current smoker | 308 | 15.3 (14.2; 17.7) | Never-smokers | vs: | ||
| status | Former smoker | 219 | 18.9 (15.9; 20.6) | Current: 0.54 (0.34; 0.84) | 0.007 | Current: 0.71 (0.42;0.22) | 0.218 |
| Never smoker | 42 | 27.1 (17.0; NA) | Former: 0.61 (0.39; 0.97) | 0.036 | Former: 0.75 (0.44;1.30) | 0.308 | |
| Weight loss | No | 406 | 20.0 (17.9; 21.1) | No vs. yes: | |||
| ≥ 10% | Yes | 120 | 12.7 (10.8; 14.8) | 0.54 (0.43; 0.68) | < 0.001 | 0.68 (0.53;0.88) | 0.003 |
| 146 | 22.4 (17.7; 26.1) | 0 vs. ≥ 2: 0.37 (0.28; 0.50) | < 0.001 | 0.62 (0.43;0.88) | 0.007 | ||
| PS | 338 | 15.4 (13.9; 17.2) | 1 vs. ≥ 2: 0.52 (0.41; 0.66) | < 0.001 | 0.69 (0.52;0.91) | 0.009 | |
| ≥2 | 99 | 11.6 (8.8; 14.7) | 0 vs. 1: 0.72 (0.57; 0.92) | 0.007 | 0.90 (0.68;1.17) | 0.422 | |
| Squamous | 309 | 16.3 (15.0; 19.0) | Adeno vs.: | ||||
| Histology | Adenoca | 220 | 18.1 (14.7; 20.6) | Squam: 0.96 (0.79; 1.18) | 0.726 | Squam: 0.93(0.68;1.26) | 0.630 |
| NOS/others | 54 | 15 (10.1; 20.1) | NOS/oth: 0.79 (0.57; 1.11) | 0.18 | NOS/oth:0.96(0.63;1.48) | 0.857 | |
| EGFR | Positive | 14 | 27.1 (20.3; NA) | Positive vs: | |||
| mutation | Negative | 128 | 15.8 (13.9; 19.7) | Negative: 0.51 (0.24; 1.10) | 0.087 | Negative:0.57(0.25;1.28) | 0.176 |
| positivity | Not tested | 441 | 16.5 (15.0; 18.9) | Not tested: 0.52 (0.25; 1.10) | 0.087 | Not tested:0.83(0.36;1.89) | 0.651 |
| Nodes | No | 411 | 14.4 (13.3;15.9) | Yes vs. no: | |||
| confirmed | Yes | 172 | 24.7 (21.0; 28.8) | 0.56 (0.45; 0.70) | < 0.001 | 0.67 (0.52;0.87) | 0.002 |
| PET-CT or | Yes | 163 | 19.6 (17.8; 22.8) | Yes vs. no: | |||
| PET scan | No | 420 | 15.4 (14.1; 17.6) | 0.73 (0.58–0.91) | 0.005 | 0.84 (0.66;1.07) | 0.160 |
Patient characteristics
| IIIA (N = 321) | IIIB (N = 262) | IIIA + IIIB (N = 583) | ||
|---|---|---|---|---|
| Characteristic | P * | |||
| N (%) | N (%) | N (%) | ||
| Age | ||||
| < 65 years | 155 (48.3) | 117 (44.7) | 272 (46.7) | |
| ≥ 65 years | 166 (51.7) | 145 (55.3) | 311 (53.3) | |
| Mean ± SD (years) | 64.8 ± 10.5 | 65.1 ± 10.1 | 64.9 ± 10.3 | 0.429 |
| Median (years) | 65.4 | 66.0 | 65.6 | |
| Gender | ||||
| Female | 92 (28.7) | 96 (37.0) | 188 (32.2) | |
| Male | 229 (71.3) | 166 (63.6) | 395 (67.8) | 0.050 |
| Smoking status | ||||
| Current smoker | 161 (50.2) | 147 (56.3) | 308 (52.8) | |
| Former smoker | 127 (39.6) | 92 (35.2) | 219 (37.6) | |
| Never smoker | 26 (8.1) | 16 (6.1) | 42 (7.2) | |
| Unknown | 7 (2.2) | 7 (2.7) | 14 (2.4) | 0.446 |
| Weight loss ≥10% within prior three months | ||||
| No | 243 (75.7) | 163 (62.5) | 406 (69.6) | |
| Yes | 50 (15.6) | 70 (26.8) | 120 (20.6) | |
| Unknown | 28 (8.7) | 29 (11.0) | 57 (9.8) | <0.001 |
| WHO performance status | ||||
| 0 | 86 (26.8) | 60 (23.0) | 146 (25.0) | |
| 1 | 194 (60.4) | 144 (54.9) | 338 (58.0) | |
| 2 | 31 (9.7) | 41 (15.7) | 72 (12.3) | |
| 3 | 10 (3.1) | 17 (6.5) | 27 (4.6) | 0.025 |
| Histology | ||||
| Squamous cell carcinoma | 176 (54.8) | 133 (51.0) | 309 (53.0) | |
| Adenocarcinoma | 115 (35.8) | 105 (40.0) | 220 (37.7) | |
| NSCLC NOS | 18 (5.6) | 18 (6.9) | 36 (6.2) | |
| Other | 12 (3.7) | 6 (2.3) | 18 (3.1) | 0.477 |