
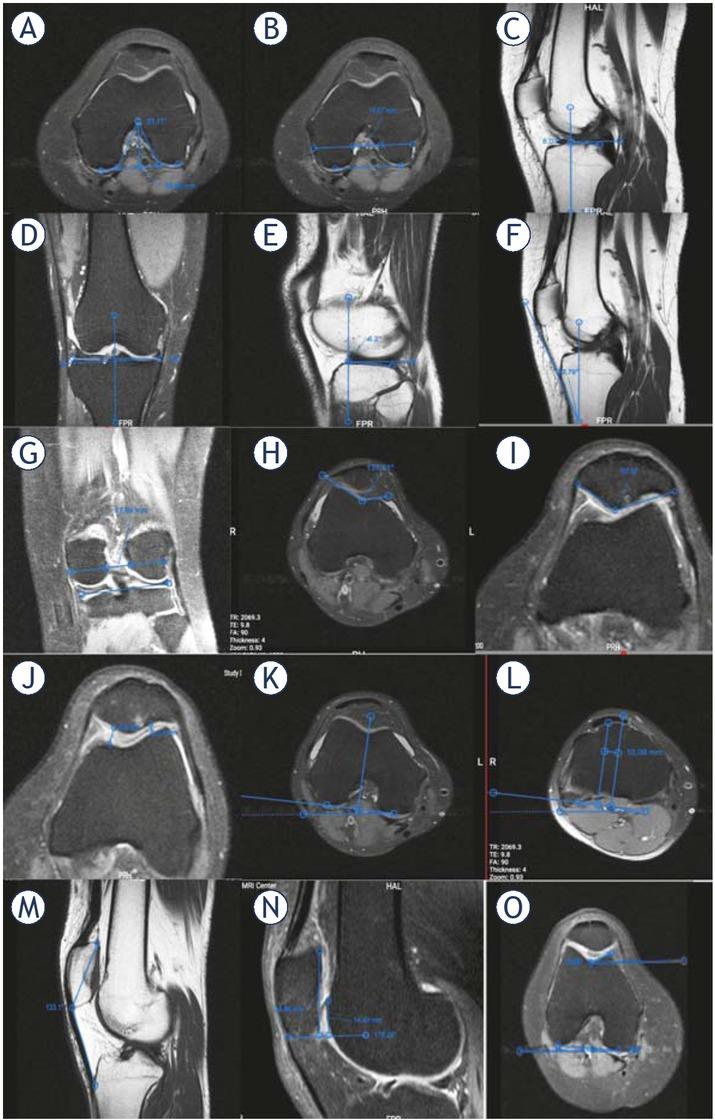
Figure 1
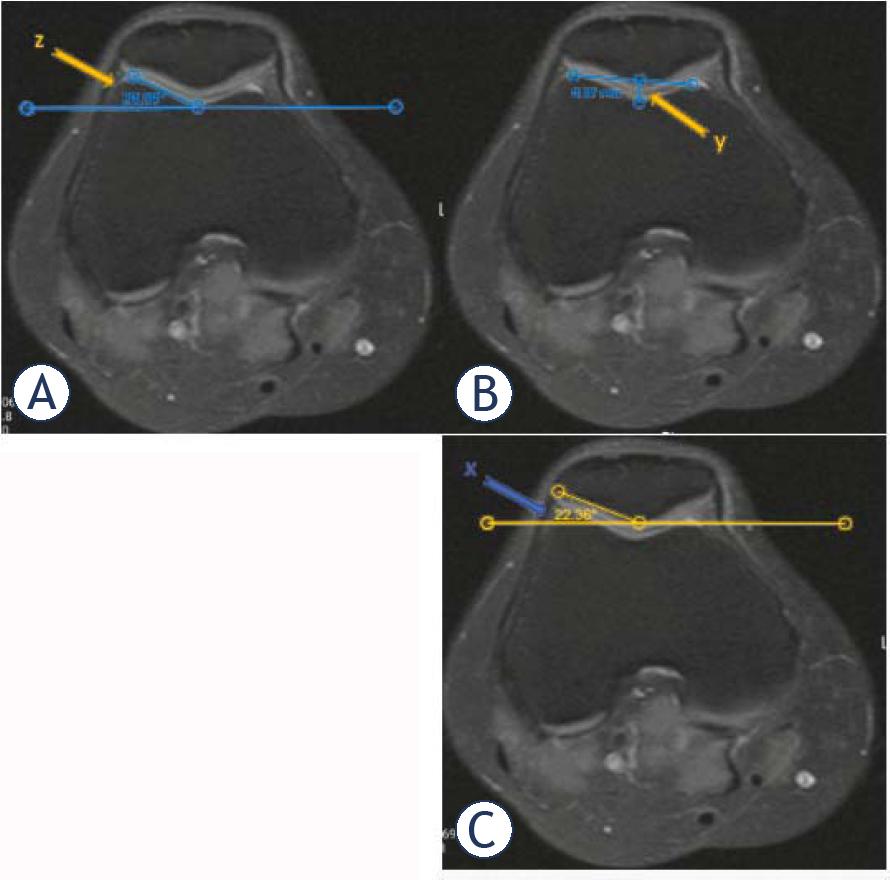
Figure 2
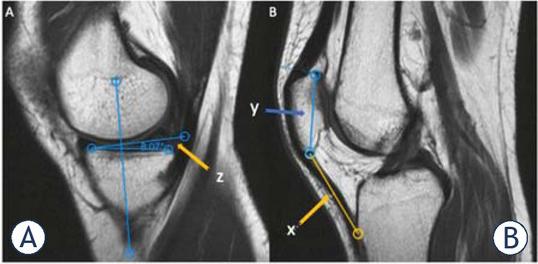
Figure 3
Predictive model for chondromalacia including MRI measurements
| MRI measurements | Odds ratio | 95% CI | P-value | Intra-rater reliability | Contribution of any increase in this parameter to chondromalacia |
|---|---|---|---|---|---|
| LTI | 1.15 | 1.03–1.30 | 0.014 | 0.992 | Increases disease probability |
| LPTA | 1.13 | 1.02–1.26 | 0.018 | 0.996 | Increases disease probability |
| MTS | 0.85 | 0.73–0.98 | 0.026 | 0.997 | Decreases disease probability |
| TD | 0.06 | 0.02–0.17 | 0.000 | 0.995 | Decreases disease probability |
| Age | 1.10 | 1.02–1.20 | 0.015 | - | Increases disease probability |
MRI measurements of the control patients versus chondromalacia cases
| MRI Measurements | Median (IQR) | Odds ratio | 95% CI IQR represents 25th–75th interquartile range, 95% CI represents 95% confidence interval for odds ratio | P-value | |
|---|---|---|---|---|---|
| Control | Case | ||||
| INA (degree) | 52.0 (48.0–57.0) | 53.0 (48.0–56.0) | 1.00 | 0.96–1.05 | 0.863 |
| IW (mm) | 21.5 (20.1–23.4) | 20.3 (19.0–21.7) | 0.77 | 0.67–0.88 | < 0.001 |
| ID (mm) | 28.2 (26.7–29.8) | 25.9 (26.7–29.8) | 0.76 | 0.68–0.85 | < 0.001 |
| MCW (mm) | 26.5 (24.9–28.5) | 24.8 (23.2–26.7) | 0.79 | 0.70–0.88 | < 0.001 |
| LCW (mm) | 27.2 (25.5–28.8) | 24.4 (23.3–26.1) | 0.77 | 0.69–0.86 | < 0.001 |
| ATS (degree) | 8.0 (5.5–11.5) | 8.0 (6.0–10.5) | 1.01 | 0.94–1.09 | 0.727 |
| CTS (degree) | 3.5 (2.0–5.0) | 4.0 (2.5–5.2) | 1.13 | 0.96–1.32 | 0.144 |
| MTS (degree) | 7.5 (5.2–9.5) | 7.0 (4.5–9.5) | 0.95 | 0.87–1.04 | 0.252 |
| LTS (degree) | 5.5 (3.5–7.5) | 5.5 (3.5–7.5) | 0.96 | 0.88–1.05 | 0.448 |
| PTTS angle (degree) | 27.0 (23.0–30.0) | 27.0 (24.0–30.0) | 1.01 | 0.95–1.08 | 0.46 |
| NWI | 0.29 (0.27–0.31) | 0.29 (0.27–0.31) | 0.18 | 0.00–6399.00 | 0.749 |
| TD (mm) | 5.30 (4.82–5.87) | 4.04 (3.51–4.60) | 0.14 | 0.08–0.24 | < 0.001 |
| SA (degree) | 140.0 (134.0–145.0) | 142.0 (137.0–150.0) | 1.04 | 1.01–1.08 | 0.009 |
| LTI (degree) | 20.0 (18.0–23.0) | 20.0 (17.5–24.0) | 0.99 | 0.93–1.05 | 0.683 |
| MTI (degree) | 18.0 (15.0–21.0) | 16.0 (13.5–20) | 0.93 | 0.89–0.99 | 0.020 |
| LPTA (degree) | 13.0 (10.0–16.0) | 14.0 (10.5–17.0) | 1.03 | 0.97–1.08 | 0.294 |
| PFA (degree) | 138.0 (133.0–142.0) | 136.0 (132.5–141.0) | 0.97 | 0.93–1.01 | 0.160 |
| PFI | 1.14 (1.01–1.35) | 1.32 (1.07–1.59) | 3.02 | 1.37–6.65 | 0.006 |
| TTTG (mm) | 12.5 (10.2–15.2) | 12.3 (10.5–16.1) | 1.01 | 0.95–1.09 | 0.603 |
| SCF (mm) | 20.5 (17.3–25.3) | 26.7 (21.7–34.8) | 1.14 | 1.09–1.19 | < 0.001 |
| CWI | 0.52 (0.50–0.54) | 0.52 (0.50–0.54) | 0.76 | 0.00–3481.00 | 0.949 |
| SWI | 0.57 (0.54–0.59) | 0.56 (0.54–0.58) | 0.01 | 0.00–34.80 | 0.270 |
| P-PT angle (degree) | 140.5 (137.0–144.0) | 140.0 (137.5–143.5) | 0.99 | 0.93–1.05 | 0.802 |
| ISI | 0.98 (0.89–1.07) | 1.00 (0.89–1.14) | 4.62 | 0.60–35.20 | 0.139 |
| PTI | 0.31 (0.26–0.36) | 0.30 (0.25–0.35) | 0.04 | 0.00–2.21 | 0.115 |
Predictive model for chondromalacia severity including MRI measurements
| MRI measurements | Odds ratio | 95%CI | P-value | Intra-rater reliability | Contribution of any increase in this parameter to chondromalacia severity |
|---|---|---|---|---|---|
| ISI | 75.89 | 2.17–2652.69 | 0.017 | 0.997 | Increases disease grade |
| Age | 1.14 | 1.07–1.21 | 0.000 | - | Increase disease grade |