
Figure 1
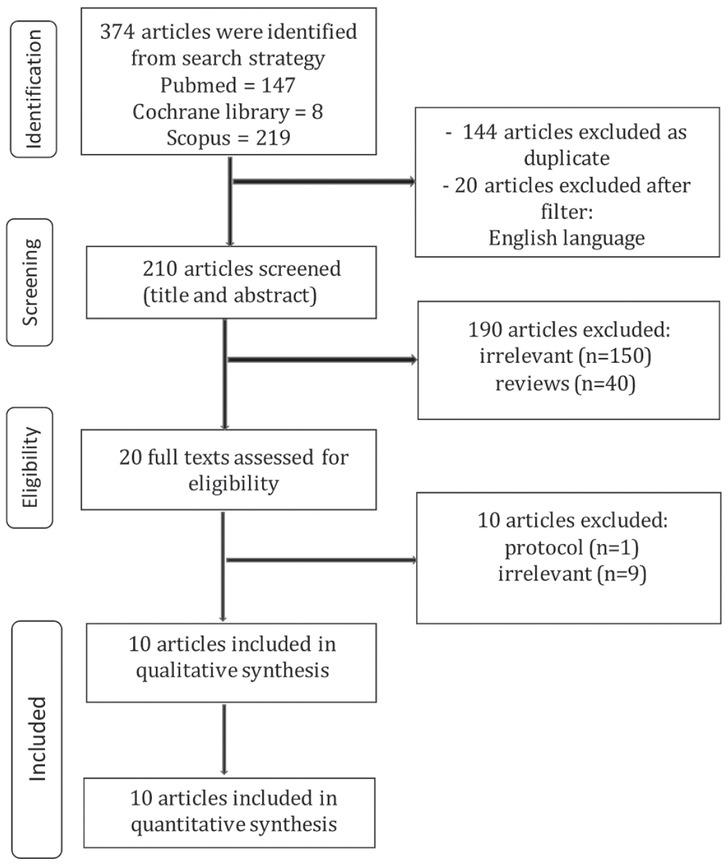
Figure 2
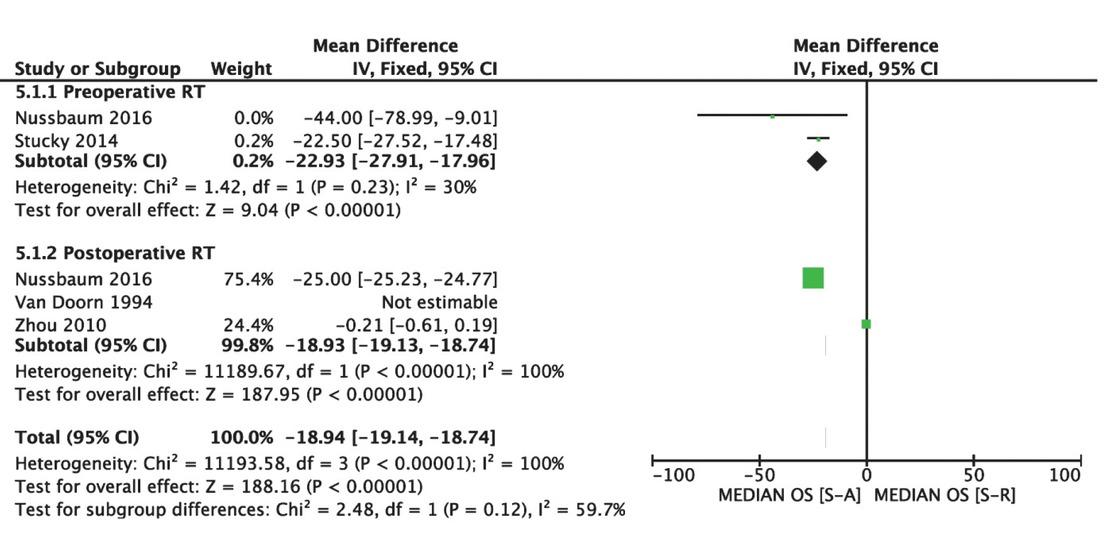
Figure 3
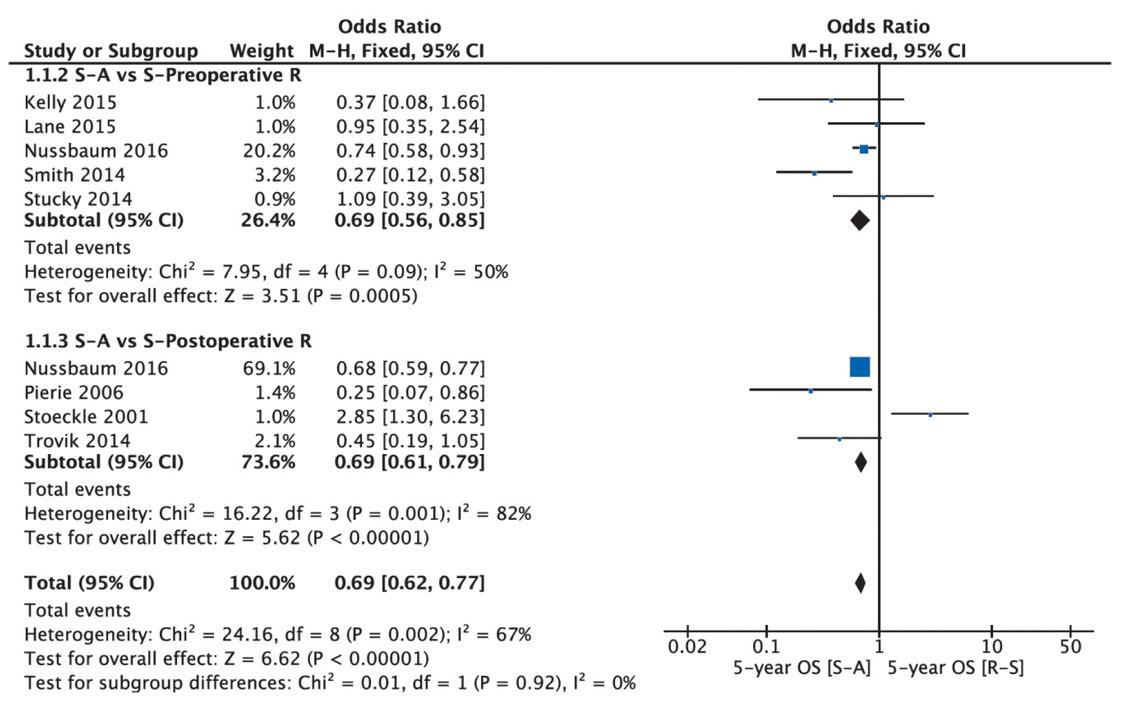
Figure 4
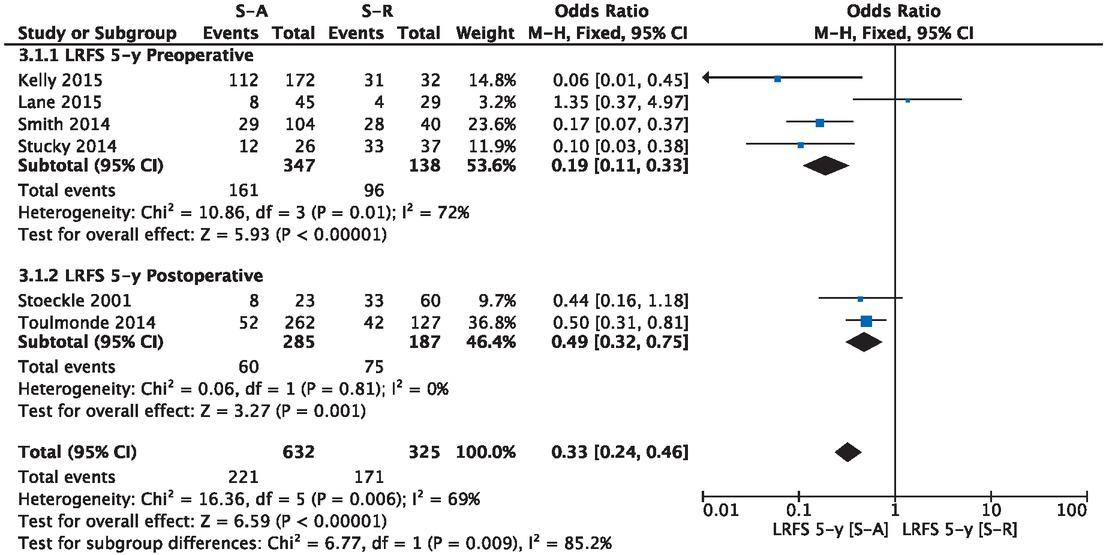
Figure 5
Characteristics
| Study ID,Year | Journal | Country | Time Period | Type of Study | Patients, n | Female, n (%) | Median Age(Range) | Stars In Ottawa | |||
|---|---|---|---|---|---|---|---|---|---|---|---|
| SA | RT+S | SA | RT+S | SA | RT+S | ||||||
| Kelly et al., 2015 [12] | Ann Surg | USA | 2003-2011 | R | 172 | 321 | 84 (49%) | 17 (53%) | 62 (26-92 | 57 (41-85) | 6 |
| Lane et al., 2015 [13] | J Surg Onc | USA | - | R | 45 | 29 | 23 (51,1%) | 16 (55,2%) | 60 (52, 68) | 57 (51, 61) | 5 |
| Nussbaum et al., 2016 [14] | Lancet Oncol | USA | 2003-2011 | R | 3322 | 5631 | 1713 (51,5%) | 250 (44%) | 59,5 (± 14,5) | 59,2 (±13,8), | 6 |
| Pierie et al., 2006 [15] | EJSO | USA | 1973-1998 | P | 21 | 412 | N/A | N/A | N/A | N/A | 5 |
| Smith et al., 2014 [16] | Radiother Oncol | Canada | 1996-2000 | R | 104 | 401 | 49 (47%) | 25 (62%) | N/A | N/A | 6 |
| Stoeckle et al., 2001 [7] | Cancer | France | 1980-1994 | R | 55 | 892 | N/A | N/A | N/A | N/A | 5 |
| Stucky et al., 2014 [17] | J Surg Onc | USA | 1996-2011 | R | 26 | 371 | 9 (35%) | 17 (46%) | 74 | 56 | 6 |
| Toulmonde et al., 2014 [18] | Annals of Oncology | France | 1988-2008 | R | 262 | 127 | - | - | - | - | 5 |
| Trovik et al., 2014 [19] | Acta Oncologica | Sweden | 1988-2009 | R | 55 | 42 | 22 (58,2%) | 15 (33%) | 63(15-83) | 61(35-82) | 6 |
| Zhou et al., 2010 [20] | Arch Surg | USA | 1988-2005 | R | 1175 | 3722 | - | - | - | - | 5 |
Summary of the analysis of the categorical and continuous outcomes
| Categorical Outcomes | n | OR (95% CI)* | p | Heterogeneity | |
|---|---|---|---|---|---|
| I2 | p | ||||
| 5-year OS total | 9 | 0.69 [0.62, 0.77] | <0.0001 | 67 % | 0.002 |
| 5-year OS preoperative RT | 5 | 0.69 [0.56, 0.85] | 0.0005 | 50 % | 0.09 |
| 5-year OS postoperative RT | 4 | 0.69 [0.61, 0.79] | <0.0001 | 82 % | 0.001 |
| RFS total | 6 | 0.33 [0.24, 0.46] | <0.0001 | 69 % | 0.006 |
| RFS preoperative RT | 4 | 0.19 [0.11, 0.33] | <0.0001 | 72 % | 0.001 |
| RFS postoperative RT | 2 | 0.49 [0.32, 0.75] | 0.001 | 0 % | 0.81 |
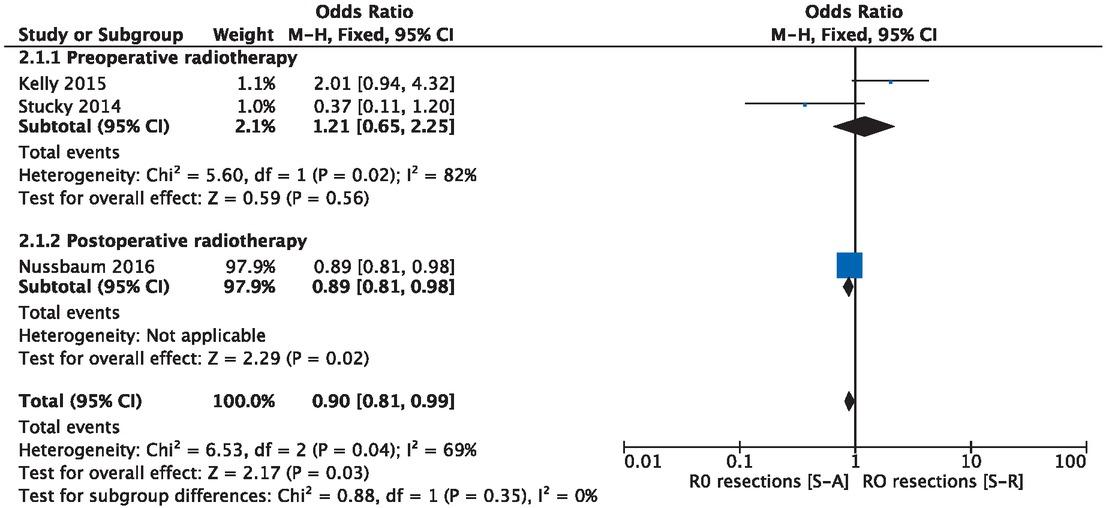
| R0 resections total | 3 | 0.90 [0.81, 0.99] | 0.03 | 69 % | 0.04 |
| R0 resections preoperative RT | 2 | 1.21 [0.65, 2.25] | 0.56 | 82 % | 0.02 |
| R0 resections postoperative RT | 1 | 0.89 [0.81, 0.98] | 0.02 | N/A | - |
| Continuous outcomes | n | WMD (95% CI) | p | I2 | p |
| MOS total | 5 | -18.94 [-19.14, -18.74] | <0.0001 | 100 % | < 0.0001 |
| MOS preoperative RT | 2 | -22.93 [-27.91, -17.96] | <0.0001 | 30 % | 0.23 |
| MOS postoperative RT | 3 | -18.93 [-19.13, -18.74] | <0.0001 | 100 % | < 0.0001- |