
Table 1
Clinical characteristics of study groups
| Characteristic | All subjects (N =782) | No disease (N = 69) | Pleural plaques (N = 410) | Asbestosis (N = 149) | MM (N = 154) | MM with SMRP at diagnosis (N = 86) | |
|---|---|---|---|---|---|---|---|
| Gender | Male, N (%) | 581 (74.3) | 52 (75.4) | 295 (72.0) | 115 (77.2) | 119 (77.3) | 69 (80.2) |
| Female, N (%) | 201 (25.7) | 17 (24.6) | 115 (28.0) | 34 (22.8) | 35 (22.7) | 17 (19.8) | |
| Age | Years, median 25%–75%) | 56.9 (50.2–64.9) | 52.9 (48.2–59.2) | 54.6 (48.8–62.2) | 59.1 (51.2–65.2) | 65 (57–70) | 66 (59–72) |
| Smoking | No, N (%) | 375 (49.0) [17] | 31 (45.6) [1] | 203 (50.9) [11] | 71 (48.0) [1] | 70 (46.7) [4] | 43 (51.2) [2] |
| Yes, N (%) | 390 (51.0) | 37 (54.4) | 196 (49.1) | 77 (52.0) | 80 (53.3) | 41 (48.8) | |
| SMRP | nmol/l, median (25%-75%) | 0.30 (0.00–0.85) [1] | 0.14 (0.00–0.58) [6] | 0.03 (0.00–0.39) [5] | 2.43 (0.44–8.62) |
[i] Number of missing data is presented in [] brackets.
MM = malignant mesothelioma; SMRP = soluble mesothelin-related peptides
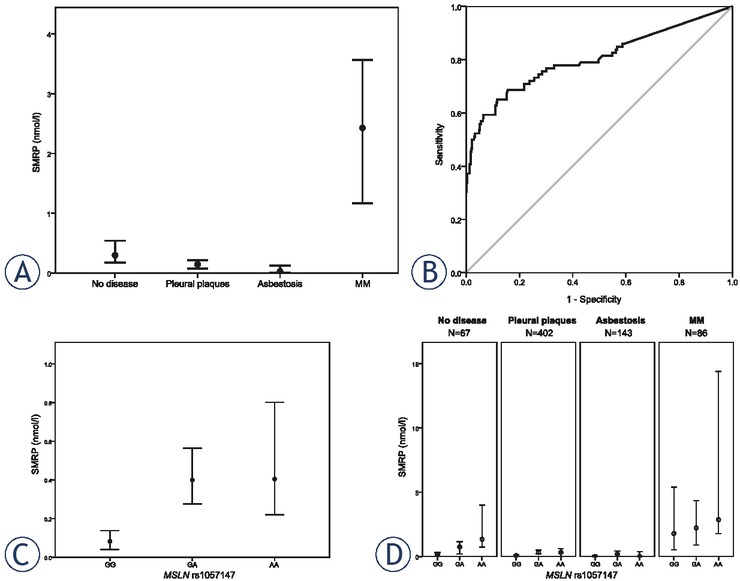
Figure 1
Median soluble mesothelin-related peptides (SMRP) levels in different groups (A), receiver operating characteristic (ROC) curve for SMRP predicting malignant mesothelioma (MM) (B) and association of MSLN rs1057147 genotype with serum SMRP levels at inclusion in the study in the whole cohort of 698 subjects (C) and for each subject group (D). Data are presented as median with 95% confidence intervals.
Table 2
ROC curve analysis according to MSLN rs1057147 genotype
| Comparison | AUC (95% CI) | p | SMRP cutoff (nmol/l) | Sensitivity | Specificity |
|---|---|---|---|---|---|
| MM vs. all other subjects | 0.802 (0.740–0.864) | < 0.001 | 1.5 | 0.593 | 0.930 |
| 1 | 0.651 | 0.864 | |||
| 1.11a | 0.651 | 0.885 | |||
| MM vs. all other subjects with MSLN rs1057147 GG genotype | 0.827 (0.767–0.888) | < 0.001 | 1.5 | 0.593 | 0.967 |
| 1 | 0.651 | 0.925 | |||
| 0.87a | 0.686 | 0.911 | |||
| MM vs. all other subjects with MSLN rs1057147 GA genotype | 0.765 (0.697–0.834) | < 0.001 | 1.5 | 0.593 | 0.882 |
| 1 | 0.651 | 0.783 | |||
| 1.57a | 0.593 | 0.896 | |||
| MM vs. all other subjects with MSLN rs1057147 AA genotype | 0.780 (0.702–0.858) | < 0.001 | 1.5 | 0.593 | 0.878 |
| 1 | 0.651 | 0.780 | |||
| 1.68a | 0.570 | 0.927 |
[i] a Cutoff with the highest sum of sensitivity and specificity.
AUC = area under the curve; MM = malignant mesothelioma; ROC = receiver operating characteristic; SMRP = soluble mesothelin-related peptides
Table 3
Odds for MM in subjects with different MSLN rs1057147 genotypes
| No disease | Pleural plaques | Asbestosis | MM | MM vs all other subjects | ||||
|---|---|---|---|---|---|---|---|---|
| Genotype | (N = 69) | (N = 410) | (N = 149) | (N = 154) | ||||
| N (%) | N (%) | N (%) | N (%) | OR (95% CI) | p | ORadj(95% CI) | padj | |
| GG | 41 (60.3) [1] | 241 (59.1) [2] | 84 (56.8) [1] | 81 (52.6) | reference | reference | ||
| GA | 21 (30.9) | 147 (36.0) | 49 (33.1) | 60 (39.0) | 1.25 (0.86–1.82) | 0.243 | 1.28 (0.87–1.90) | 0.215 |
| AA | 6 (8.8) | 20 (4.9) | 15 (10.1) | 13 (8.4) | 1.43 (0.73–2.80) | 0.292 | 1.30 (0.64–2.64) | 0.472 |
| GA+AA | 27 (39.7) | 167 (40.9) | 64 (43.2) | 73 (47.4) | 1.28 (0.90–1.82) | 0.174 | 1.29 (0.89–1.87) | 0.187 |
[i] Number of missing data is presented in [] brackets.
adj = adjusted for age; CI = confidence interval; MM = malignant mesothelioma; OR = odds ratio
Table 4
Serum SMRP levels according to MSLN rs1057147 genotype
| MSLN rs1057147 | MSLN rs1057147 | |||||||
|---|---|---|---|---|---|---|---|---|
| Group | GG genotype | GA genotype | AA genotype | Kruskal-Wallis test statistic | pa | GA+AA genotype | Mann-Whitney U | pb |
| SMRP (nmol/l, median (25%–75%) | SMRP (nmol/l, median (25%–75%) | SMRP (nmol/l, median (25%–75%) | SMRP (nmol/l, median (25%–75%) | |||||
| All subjects N = 698 | 0.08 (0.00–0.45) | 0.40 (0.00–1.11) | 0.41 (0.00–1.61) | 31.617 | 0.001 < | 0.40 (0.00–1.15) | 73900 | < 0.001 |
| No disease N = 67 | 0.16 (0.00–0.44) | 0.75 (0.19–1.40) | 1.34 (0.98–2.41) | 18.657 | 0.001 < | 0.84 (0.25–2.55) | 836.5 | < 0.001 |
| Pleural plaques N = 402 | 0.07 (0.00–0.33) | 0.32 (0.00–0.88) | 0.32 (0.00–0.75) | 18.839 | 0.001 < | 0.32 (0.00–0.88) | 24272.5 | < 0.001 |
| Asbestosis N = 143 | 0.00 (0.00–0.21) | 0.18 (0.00–0.64) | 0.00 (0.00–0.37) | 5.817 | 0.055 | 0.14 (0.00–0.55) | 2951 | 0.067 |
| No disease or pleural plaques or asbestosis N = 612 | 0.07 (0.00–0.33) | 0.33 (0.00–0.88) | 0.33 (0.00–0.76) | 31.125 | < 0.001 | 0.33 (0.00–0.87) | 56942.5 | < 0.001 |
| MM N = 86 | 1.79 (0.34–8.47) | 2.22 (0.52–8.61) | 2.87 (1.80–12.14) | 1.716 | 0.424 | 2.62 (0.88–9.07) | 986 | 0.595 |
[i] a additive model; b dominant model
MM = malignant mesothelioma; SMRP = soluble mesothelin-related peptides
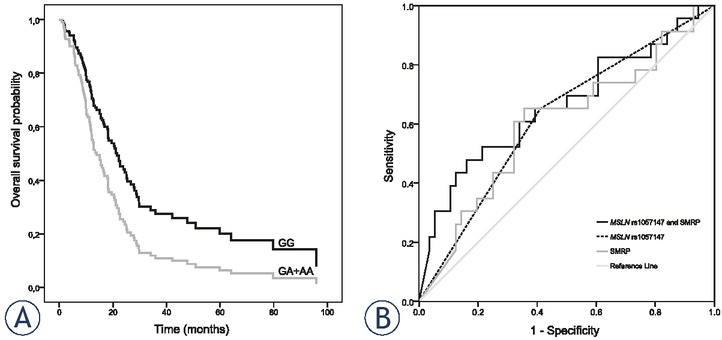
Figure 2
The influence of MSLN rs1057147 genotype on overall survival (A) and receiver operating characteristic (ROC) curve for MSLN rs1057147 and soluble mesothelin-related peptides (SMRP) predicting overall survival above median (B).