
Table 1
Baseline patients’ characteristics
| Baseline variable | Patients (n = 127) | % |
|---|---|---|
| Age (years) | ||
| Mean (range) | 73.82 (59–90) | |
| Heigth (m) | ||
| Mean (range) | 1.71 (1.58–1.95) | |
| Weight (kg) | ||
| Mean (range) | 78.60 (59–120) | |
| BMI | ||
| Mean (range) | 26.75 (19.57–39.18) | |
| Gleason score | ||
| Mean (range) | 6.3 (5–10) | |
| 5 | 1 | 0.79 |
| 6 | 3 | 2.36 |
| 7 | 38 | 29.92 |
| 8 | 30 | 23.62 |
| 9 | 28 | 22.04 |
| 10 | 2 | 1.59 |
| Unknown | 25 | 19.68 |
| ECOG Performance status | ||
| Mean (range) | 0.86 (0–3) | |
| 0 | 39 | 30.7 |
| 1 | 68 | 53.54 |
| 2–3 | 20 | 15.75 |
| Extent of skeletal disease | ||
| < 6 metastases | 18 | 14.17 |
| 6–20 metastases | 46 | 36.22 |
| > 20 metastases | 63 | 49.61 |
| No. of previous systemic treatments after | ||
| castration resistance (Docetaxel, Cabazitaxel, | ||
| Abiraterone, Enzalutamide) | ||
| 0 | 32 | 25.19 |
| 1 | 42 | 33.07 |
| 2 | 32 | 25.19 |
| ≥ 3 | 21 | 16.53 |
| No. of therapy’s cycles administered | ||
| Mean (range) | 5.56 (2–6) | |
| 2 | 3 | 2.36 |
| 3 | 3 | 2.36 |
| 4 | 10 | 7.87 |
| 5 | 14 | 11.02 |
| 6 | 97 | 76.38 |
| No. of systemic treatments after Radium223 | ||
| Docetaxel | 11 | 8.6 |
| Cabazitaxel | 0 | 0 |
| Abiraterone | 2 | 1.5 |
| Enzalutamide | 6 | 4.7 |
| Baseline Hb | ||
| Median (range) | 12.14 (7.5–15) | |
| < 12 g/dl | 54 | 42.51 |
| ≥ 12 g/dl | 73 | 57.48 |
| Baseline tALP* | ||
| Median (range) | 300 (34–1750) | |
| < 226 U/l | 79 | 62.2 |
| ≥ 226 U/l | 48 | 87.8 |
| Baseline PLT (103/mm3) | ||
| Median (range) | 249 (74–763) | |
| Baseline PSA | ||
| < 20 ng/ml | 42 | 33.07 |
| ≥ 20 ng/ml | 85 | 66.92 |
[i] *Cut-off value validated in a previous study16
BMI = Body mass index; ECOG = Eastern Cooperative Oncology Group; Hb = hemoglobin; tALP = total alkaline phosphatase; PLT = platelets count; PSA = serum prostate specific antigen
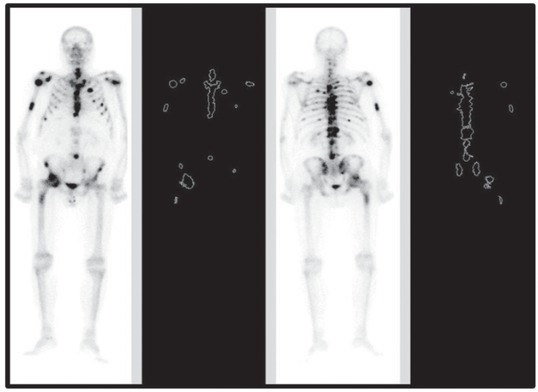
Figure 1
Patient of our cohort with bone metastases analyzed with DASciS software. Bone scan index (BSI) value = 5.26%.
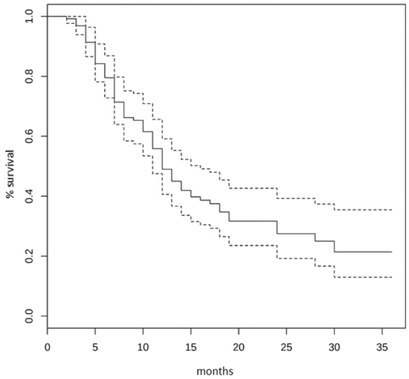
Figure 2
Kaplan-Meier curve for overall survival.
Table 2
Expected survival for baseline bone scan index (BSI) intervals
| % BSI | Patients number (n = 127) | Median survival (months) | 0.95 LowCL (months) | 0.95 UpCL (months) |
|---|---|---|---|---|
| 0–3 | 59 | 28 | 19 | NA |
| 3–5 | 33 | 11 | 9 | 12 |
| > 5 | 35 | 5 | 5 | 7 |
[i] CL = confidence level
Table 3
Univariate and multivariable analysis of overall survival (OS) in relation to baseline variables
| Clinical covariates | Univariate HR (95% models CI) | p-value | Multivariable HR (95% CI) model | p-value |
|---|---|---|---|---|
| BSI | 1.80 (1.61–2.02) | < 0.001 | 1.79 (1.59–2.01) | < 0.001 |
| Age (years) | 1.02 (0.99–1.05) | 0.184 | ||
| BMI | 0.94 (0.89–1.00) | 0.057 | ||
| Gleason Score | 0.97 (0.91–1.04) | 0.414 | ||
| ECOG Performance Status | 1.97 (1.48–2.64) | < 0.001 | 1.74 (1.29–2.36) | < 0.001 |
| N of previous systemic treatments | 1.35 (1.12–1.164) | 0.002 | ||
| Baseline Hb | 0.73 (0.64–0.84) | < 0.001 | ||
| Baseline PLT / 100 | 1.51 (1.19–1.92) | < 0.001 | ||
| Baseline PSA / 100 | 1.06 (1.02–1.12) | 0.006 | ||
| Baseline tALP /100 | 1.11 (1.06–1.17) | < 0.001 |
[i] BMI = body mass index; BSI = bone scan index; CI = Confidence interval; ECOG = Eastern Cooperative Oncology Group; Hb = hemoglobin; HR = hazard ratio; PLT = platelets count; PSA= serum prostate specific antigen; tALP = total alkaline phosphatase
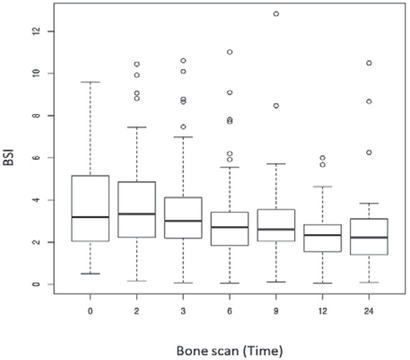
Figure 3
Bone scan index (BSI) over time.
0 = baseline bone scan; 2–3 = bone scan after 2 and 3 cycles of Ra-223 therapy; 6 = bone scan after treatment’s end; 9 - 12 - 24 = follow-up scintigraphic image study respectively after 3 months, 6 months and 1.5 year from the end of the treatment
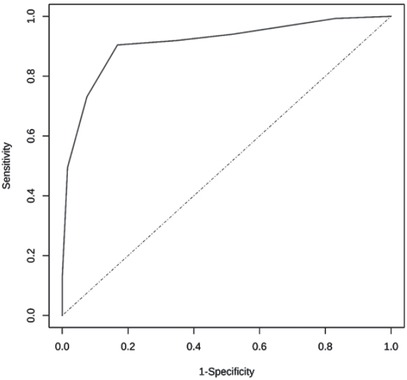
Figure 4
ROC curve of overall survival (OS) prediction for a score based on combining bone scan index (BSI) and 3-PS (AUC 91%).
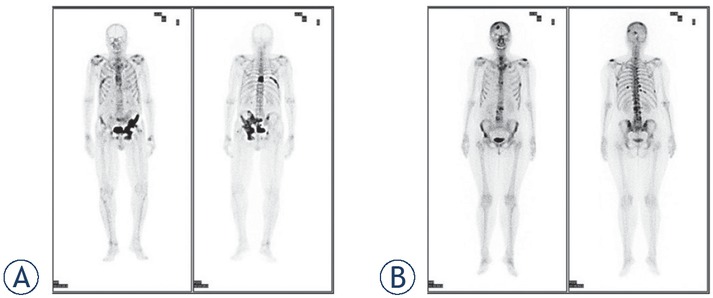
Figure 5
99mTc-HMDP Bone scan, example of evaluation of load of the disease. (A) Few but very extensive bone metastases. Bone scan index (BSI) value = 6.13%. (B) numerous but small bone metastases. BSI value = 3.4%.