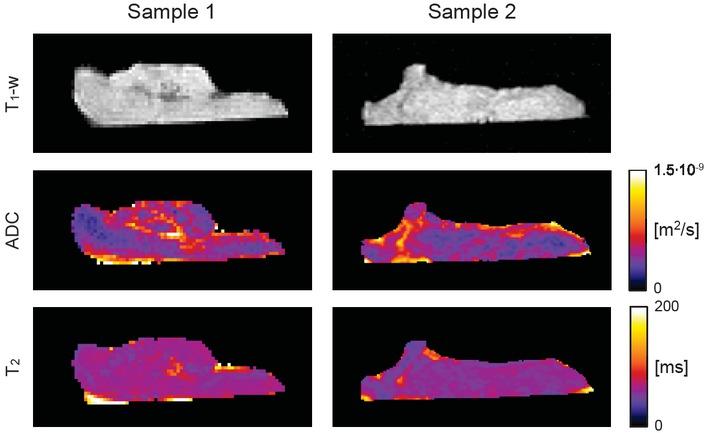
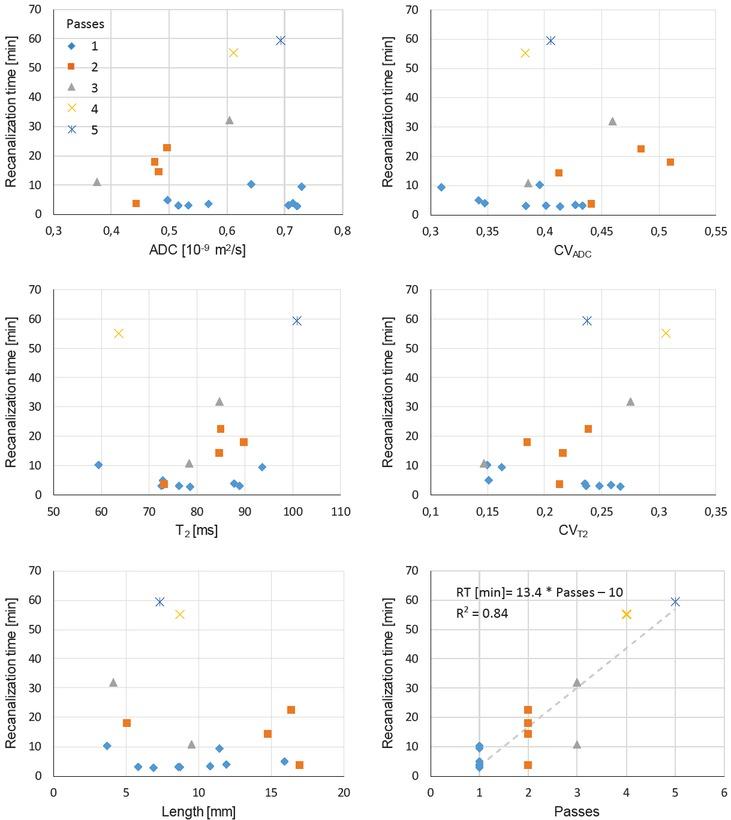
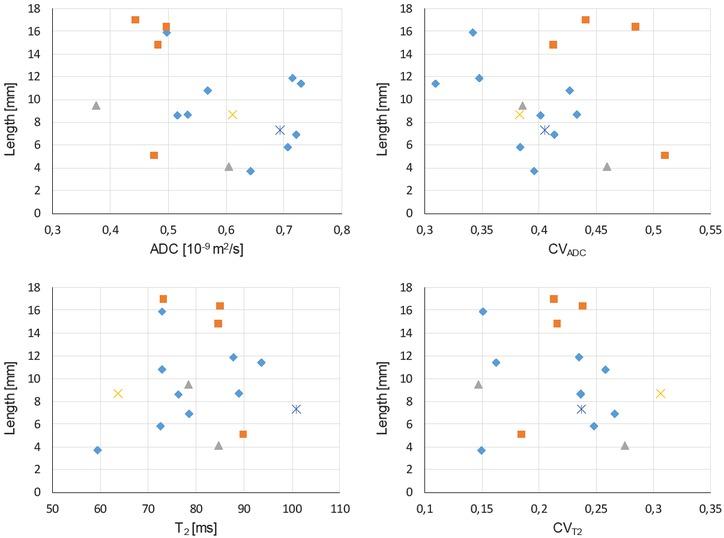
Have a personal or library account? Click to login
Retrieved cerebral thrombi studied by T2 and ADC mapping: preliminary results Cover

Retrieved cerebral thrombi studied by T2 and ADC mapping: preliminary results

Open Access
|Nov 2019

Figures & Tables

Figure 1

Two representative cerebral thrombi presented by central-slice T1- weighetd images, ADC and T2 maps. Low ADC and T2 values, shown in dark blue, correspond to regions of higher compaction while brighter regions are less compact regions that are more susceptible to thrombolytic therapy. From the images can also be seen that variability of ADC values across the thrombi is considerably higher than that of T2 values.

Figure 2

Graphs of correlation between the recanalization time (RT) of mechanical thrombectomy and different thrombi parameters: sample-mean apparent diffusion coefficient (ADC), within-sample coefficient of variation of apparent diffusion coefficient (CVADC), sample-mean spin-spin relaxation time (T2), within-sample coefficient of variation of spin-spin relaxation time (CVT2), thrombus length (Length), and number of thrombectomy procedure passes (Passes). Colour (symbol type) of experimental points indicates number of thrombectomy passes.

Figure 3

Graphs of correlation between the thrombus length (Length) and: sample-mean apparent diffusion coefficient (ADC), within-sample coefficient of variation of apparent diffusion coefficient (CVADC), sample-mean spin-spin relaxation time (T2), and within-sample coefficient of variation of spin-spin relaxation time (CVT2). Color (symbol type) of experimental points indicates number of thrombectomy passes as defined in Figure 2.

Pearson correlation coefficient for different pairs of thrombi parameters_ Correlation coefficients are sorted by their decreasing absolute values

PairρPairρPairρ
Passes-RT0.92T2-Passes0.24CVADC-Length-0.14
ADC-CVADC-0.43Length-RT-0.22Length-Passes-0.13
ADC-Length-0.41T2-RT0.21ADC-T20.13
CVT2-RT0.38CVADC-Passes0.19CVADC-T20.12
ADC-CVT20.32CVT2-Length-0.16ADC-Passes-0.09
CVADC-CVT20.28ADC-RT0.15T2-Length0.06
CVT2-Passes0.27CVADC-RT0.14T2-CVT2-0.01

MRI sequence parameters

Sequence parameterMRI sequence
3D spin-echo3D PGSE DWI3D multi-echo
Field of view [mm3]20 x 10 x 1020 x 10 x 1020 x 10 x 10
Imaging matrix128 x 64 x 64128 x 64 x 16128 x 64 x 16
Spatial resolution [μm3]156 x 156 x 156156 x 156 x 625156 x 156 x 625
Echo/inter-echo time [ms]53416
Repetition time [ms]10010351930
Signal averages1022
Number of echoes118
b-values [s/mm2]/0, 260, 620, 1250/
Scan time [h]14.72.3

Significance of differences between the single-pass (n = 9) and multi-pass (n = 8) thrombectomy groups for different parameters analysed by group-average values and by the t-test

Thrombectomy group / t-testADC_g[10-9 m2/s]CVADC_gT2_g[ms]CVT2_gLength_g[mm]RT_g[min]
Single-pass0.63 ± 0.10.38 ± 0.0478 ± 100.22 ± 0.059.3 ± 3.74.8 ± 2.8
Multi-pass0.52 ± 0.10.44 ± 0.0582 ± 110.23 ± 0.0510.4 ± 5.127 ± 20
p-value0.050.030.410.640.620.006
DOI: https://doi.org/10.2478/raon-2019-0056 | Journal eISSN: 1581-3207 | Journal ISSN: 1318-2099
Language: English
Page range: 427 - 433
Submitted on: Oct 3, 2019
|
Accepted on: Oct 22, 2019
|
Published on: Nov 20, 2019
In partnership with: Paradigm Publishing Services
Publication frequency: 4 issues per year

© 2019 Jernej Vidmar, Franci Bajd, Zoran V. Milosevic, Igor J. Kocijancic, Miran Jeromel, Igor Sersa, published by Association of Radiology and Oncology
This work is licensed under the Creative Commons Attribution-NonCommercial-NoDerivatives 3.0 License.