
Table 1
Dose volume parameters for PTV, GTV, Spinal Cord and Cauda Equina for MRIdian Linac IMRT plans Vs TrueBeamTM STx VMAT plans
| Structures | TrueBeamTM STx VMAT | MRIdian Linac IMRT | p-value |
|---|---|---|---|
| PTV | Median(range) | Median(range) | |
| D98% (Gy) | 25.7 (15.6–29.5) | 26.5 (17.7–29.7) | 0.20 |
| D50% (Gy) | 29.0 (27.9–39.1) | 30.0 (26.4–33.2) | 0.77 |
| Conformity Index | 0.97 (0.93–1.0) | 0.97 (0.90–1.0) | 0.13 |
| Dose Homogeneity Index | 0.22 (0.05–0.6) | 0.19 (0.1–0.57) | 0.49 |
| R50 | 6.1 (2.9–16.7) | 5.2 (2.8–11.9) | 0.05 |
| GTV | |||
| D50% (Gy) | 31.6 (30.4–34.2) | 31.7 (31.0–34.6) | 0.36 |
| D98% (Gy) | 30.12 (25–33.63) | 30.35 (29.17–32.89) | 0.23 |
| Conformity Index | 0.99 (0.95–1.0) | 0.99 (0.96–1.0) | 0.58 |
| Dose Homogeneity Index | 0.09 (0.04–0.33) | 0.08 (0.01–0.18) | 0.30 |
| R50 | 32 (6.08–69.0) | 29 (5.8–66.0) | 0.01 |
| Spinal Cord | |||
| Max dose (Gy) | 12.6 (9.1–15.6) | 13.3 (10.35–17.3) | 0.13 |
| D0.03 (Gy) | 12 (9.0–15.3) | 12.8 (9.5–16.5) | 0.25 |
| Cauda Equina | |||
| Max dose (Gy) | 16 (0.22–28.0) | 18 (0.3–32) | 0.38 |
| D0.03 (Gy) | 13 (0.2–20.0) | 16 (0.25–31) | 0.07 |
Table 2
Detailed Dose volume histogram parameters for PTV, GTV, Spinal Cord and Cauda Equina for MRIdian Linac IMRT plans Vs TrueBeamTM STx VMAT plans
| PTV | GTV | Spinal Cord | Cauda Equina | |||||||||||||||
|---|---|---|---|---|---|---|---|---|---|---|---|---|---|---|---|---|---|---|
| Case # | Volume | Maximum | Dose (Gy) | D95 ( | Gy) | Volume | Maximum | Dose (Gy) | D95 ( | Gy) | Maximum | Dose (Gy) | D0.03 cc | (Gy) | Maximum | Dose (Gy) | D0.03 | cc (Gy) |
| (cc) | MRIdian Linac IMRT | True Beam VMAT | MRIdian Linac IMRT | True Beam VMAT | (cc) | MRIdian Linac IMRT | True Beam VMAT | MRIdian Linac IMRT | True Beam VMAT | MRIdian Linac IMRT | True Beam VMAT | MRIdian Linac IMRT | True Beam VMAT | MRIdian Linac IMRT | True Beam VMAT | MRIdian Linac IMRT | True Beam VMAT | |
| 1 | 60.37 | 34.69 | 35.44 | 27.43 | 27.50 | 7.02 | 34.69 | 35.44 | 32.46 | 33.76 | 14.82 | 14.77 | 14.67 | 14.47 | 19.70 | 21.72 | 19.67 | 20.19 |
| 2 | 50.63 | 32.45 | 32.27 | 27.00 | 27.31 | 6.82 | 32.94 | 32.41 | 30.11 | 30.05 | 13.33 | 13.45 | 13.02 | 13.10 | 20.00 | 21.15 | 19.92 | 18.95 |
| 3 | 66.3 | 36.41 | 37.00 | 27.75 | 27.12 | 27.67 | 36.41 | 37.00 | 32.58 | 29.61 | 17.01 | 11.69 | 16.56 | 10.90 | 21.07 | 14.12 | 20.23 | 13.58 |
| 4 | 47.63 | 31.68 | 30.85 | 27.19 | 27.94 | 18.8 | 34.02 | 33.45 | 30.06 | 30.52 | 13.25 | 15.65 | 12.62 | 15.34 | 24.08 | 21.19 | 22.48 | 19.79 |
| 5 | 2.6 | 33.87 | 30.71 | 27.73 | 27.26 | 0.9 | 33.87 | 32.02 | 30.24 | 30.21 | 12.58 | 13.81 | 11.92 | 12.90 | 9.31 | 12.37 | 7.73 | 7.56 |
| 6 | 3.93 | 33.52 | 31.40 | 27.67 | 27.89 | 1.65 | 33.52 | 34.96 | 32.17 | 27.39 | 10.35 | 9.10 | 10.32 | 9.09 | 16.44 | 18.01 | 12.58 | 12.32 |
| 7 | 3.05 | 32.64 | 30.88 | 27.50 | 27.82 | 1.07 | 32.65 | 33.70 | 30.44 | 29.02 | 11.17 | 10.10 | 11.15 | 10.09 | 32.13 | 28.01 | 31.16 | 19.32 |
| 8 | 25.43 | 32.73 | 34.07 | 27.92 | 27.99 | 2.31 | 32.73 | 34.07 | 30.31 | 31.43 | 13.72 | 10.98 | 13.22 | 10.36 | 13.72 | 10.6 | 13.19 | 10.25 |
| 9 | 29.02 | 33.95 | 34.14 | 27.50 | 27.60 | 1.89 | 35.70 | 34.14 | 30.05 | 30.52 | 11.04 | 9.25 | 9.53 | 8.96 | 0.32 | 0.22 | 0.25 | 0.21 |
| 10 | 38.29 | 33.02 | 33.95 | 27.88 | 27.02 | 2.51 | 33.02 | 33.95 | 30.45 | 30.51 | 17.30 | 14.11 | 14.51 | 13.75 | 3.54 | 3.67 | 3.20 | 3.40 |
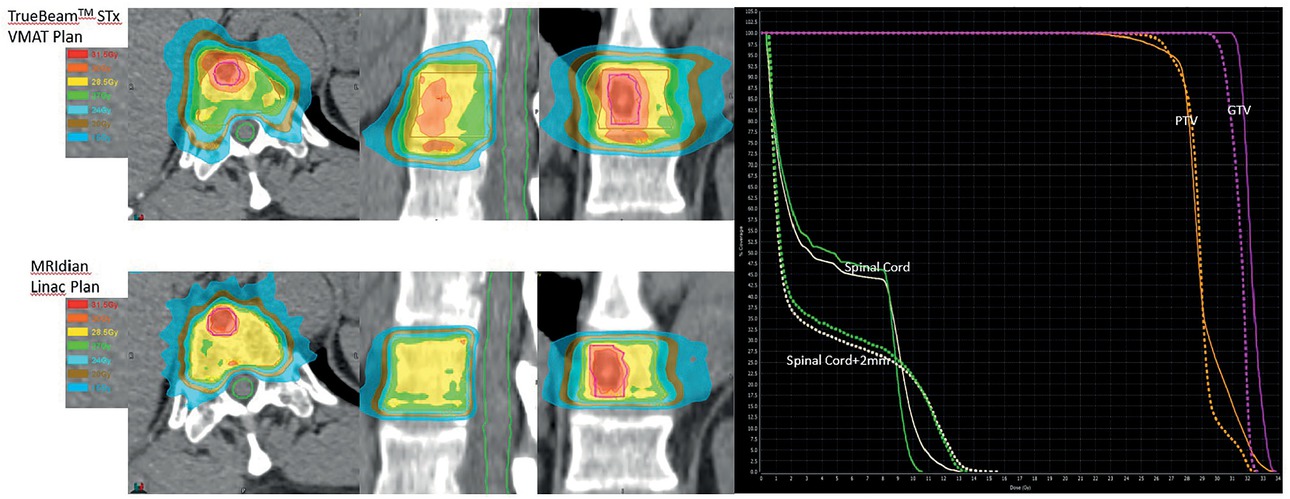
Figure 1
Isodose distribution (right) for TrueBeamTM STx VMAT and MRIdian Linac Plans: 30 Gy to gross tumor volume (GTV) and 27 Gy to planning target volume (PTV) in 3 fractions. On left, solid and dashed lines represents dose volume histogram for TrueBeamTM STx VMAT and MRIdian Linac Plans for GTV, PTV, Spinal Cord and Spinal Cord+2mm.
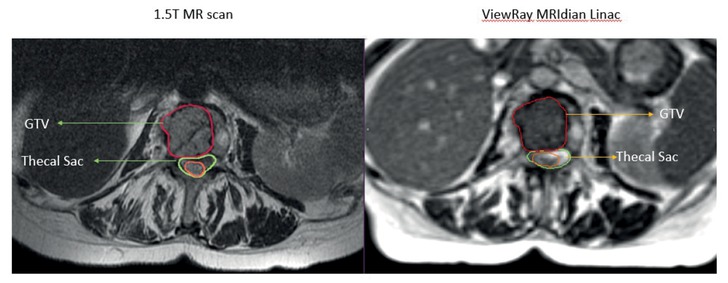
Figure 2
A metastatic tumor in the vertebral body of lumbar spine and adjacent spinal cord scan acquired on 1.5T diagnostic magnetic resonance (MR) and 0.345T ViewRay MRIdian Linac system. MRIdian scan allows for accurate delineation of the tumor and the spinal cord without having to rely on the fused diagnostic MR scan.
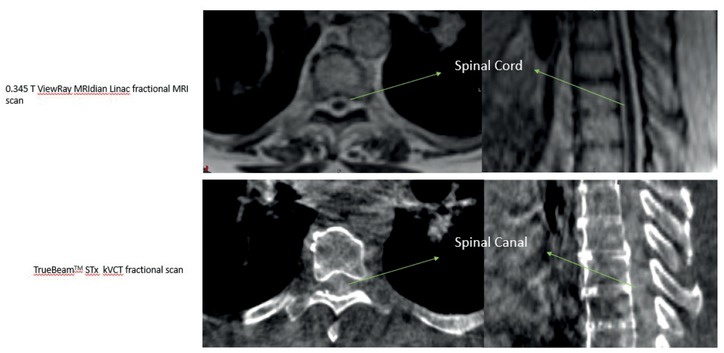
Figure 3
Fractional 0.345T MRIdian Linac MR scan (Top) and Kilo Voltage Cone Beam (Bottom) used for daily setup verification before radiotherapy treatment. Visibility of spinal cord on 0.345T is demonstrated increasing the accuracy on treatment delivery.
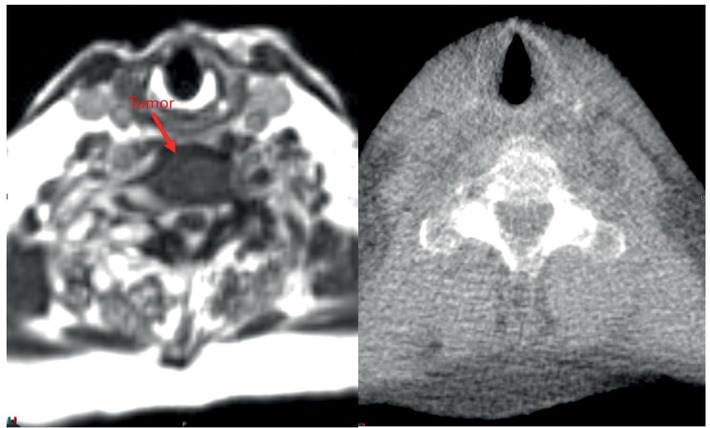
Figure 4
Fractional 0.345T MRIdian Linac MR scan (Left) and TomoTherapy® Mega Voltage CT (Right) used for daily setup verification before radiotherapy treatment. Visibility of target (red) on 0.345T is demonstrated.
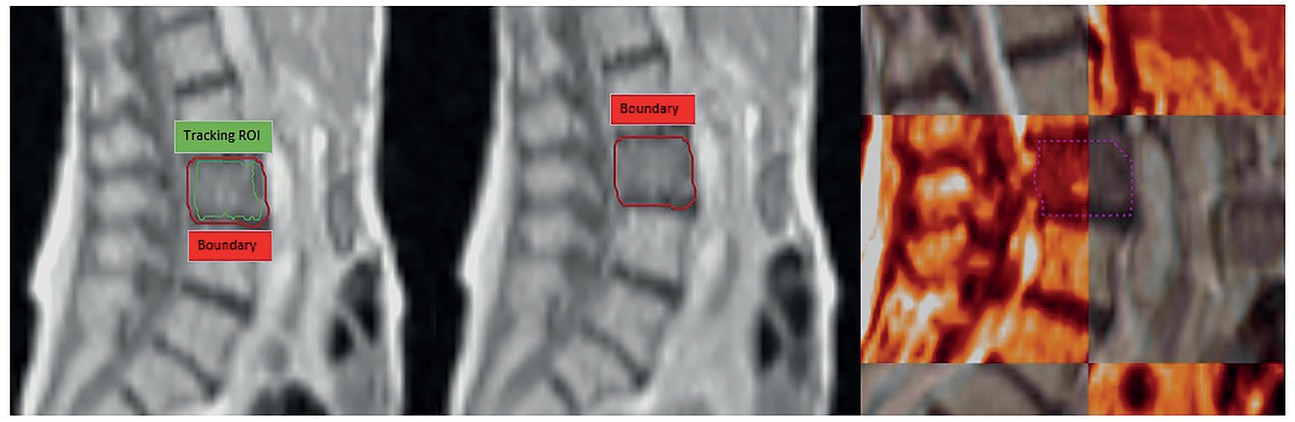
Figure 5
0.345T MRIdian Linac cine acquired in sagittal plane. Any changes in reference setup results in shutting the radiation beam off as tracking structure (green) moves outside the boundary (red).