
Figure 1
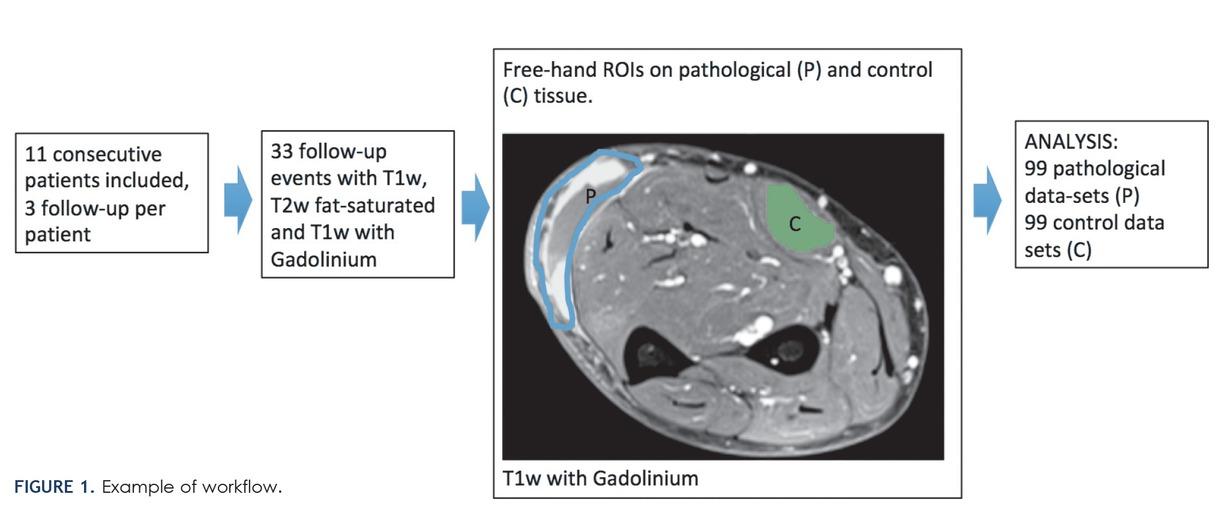
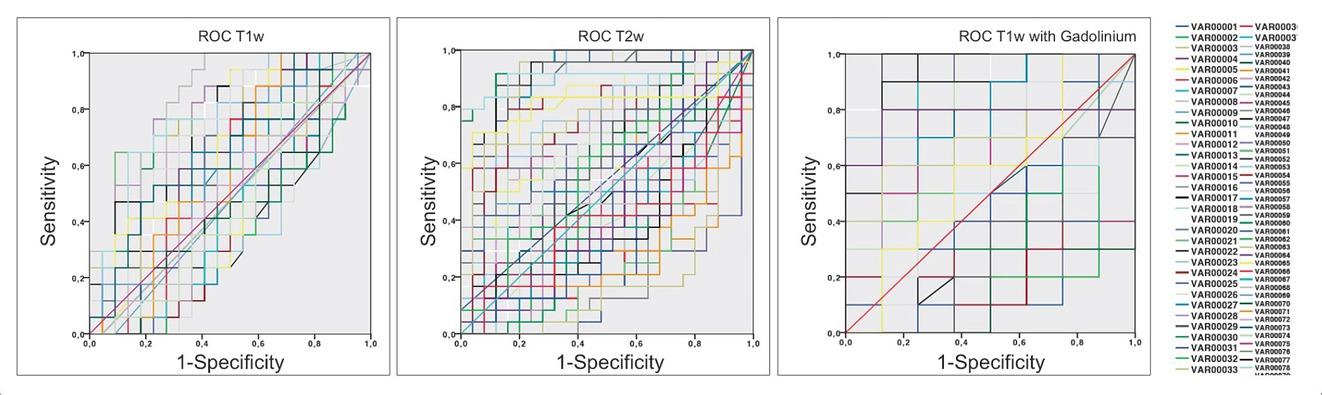
Figure 2
MRI Parameters
| Manufacturer | Siemens Healthcare, Erlangen, Germany |
|---|---|
| T1-weighted MR imaging | |
| Repetition time / echo time (TR/TE) | 500/8 |
| Acquisition voxel size (mm3) | 0.6x0.7x3.0 |
| T2-weighted MR imaging* | |
| Repetition time / echo time (TR/TE) | 6200/110 |
| Acquisition voxel size (mm3) | 0.6x0.7x3.0 |
| T1-weighted MR imaging* with Gadolinium | |
| Repetition time / echo time (TR/TE) | 5/3 |
| Acquisition voxel size (mm3) | 0.6x0.7x3.0 |
ROC results according to different MRI sequences of the selected features_* T2-weighted MR imaging and T1-weighted MR imaging with Gadolinium are acquired with fat-saturation_ Areas under the curve for differentiation of normal and pathological tissue (LR) had p < 0_05
| Sequence | Minimum AUC | 95%CI | Maximum AUC | 95%CI |
|---|---|---|---|---|
| T1-weighted MR imaging | 0.71 | 0.54–0.88 | 0.84 | 0.77–0.96 |
| T2-weighted MR imaging* | 0.81 | 0.67–0.95 | 0.91 | 0.83–1.00 |
| Twith 1-weighted Gadolinium MR imaging* | 0.87 | 0.69–1.00 | 0.96 | 0.87–1.00 |
Distribution of the extremity soft tissue sarcoma patients’ clinical characteristics in 19 pathological findings of 11 patients in 33 follow-up events_ N = 3 patients had multiple lesions
| Clinical Characteristic | |
|---|---|
| Age (years) | 57.8 ± 17.8 |
| Tumor size (mm) | 26,2 ± 16.9 |
| Grade (%) | |
| G1 | 4 (21) |
| G2 | 6 (37) |
| G3 | 8 (42) |
| Unassigned | 1 (5) |
| Depth (%) | |
| Superficial | 6 (32) |
| Deep | 13 (68) |
| Location (%) | |
| Upper extremity | 5 (26) |
| Lower extremity | 14 (74) |
| Histology (%) | |
| Pleomorphic liposarcoma | 6 (33) |
| Myxofibrosarcoma | 5 (27) |
| Myxoid liposarcoma | 2 (10) |
| Leiomyosarcoma | 2 (10) |
| Nerve sheath tumors | 2 (10) |
| Synovial sarcoma | 2 (10) |
Feature domain according to different MRI sequences
| Feature | Description | Significance | T1-weighted MR imaging | T2-weighted MR imaging* | T1-weighted MR imaging with Gadolinium |
|---|---|---|---|---|---|
| Shape domain | descriptors of the three-dimensional size and shape of the ROI. | These features are independent from distribution the gray in level the ROI intensity and are therefore only calculated on the non-derived image and mask | 1 | 1 | 2 |
| First order | Mean, standard deviation, median, and range; first-order differentials computed using Sobel operators | Localize hypo- and hyperintense regions; gradients detect edges and quantify region boundaries | 1 | 1 | 1 |
| Gray level co-occurrence matrix (GLCM) | Localization of regions with significant intensity changes; gradients detect edges and quantify region boundaries | Localizes regions based on underlying heterogeneity of voxel intensities | 3 | 7 | 6 |
| Gray level run lenght matrix (glrlm) | quantifies gray level runs, which are defined as the length in number of pixels, of consecutive pixels that have the same gray level value. | In a gray level run length matrix the element describes the number of runs with gray level and length occur in the image (ROI) along angle | 2 | 3 | 6 |
| Gray level size zone matrix (glszm) domain | It is an advanced statistical matrix used for texture characterization. It estimates bivariate conditional probability density function of the image distribution values | represent the count of how many times a given size of given grey level occur | 0 | 0 | 0 |