
Figure 1
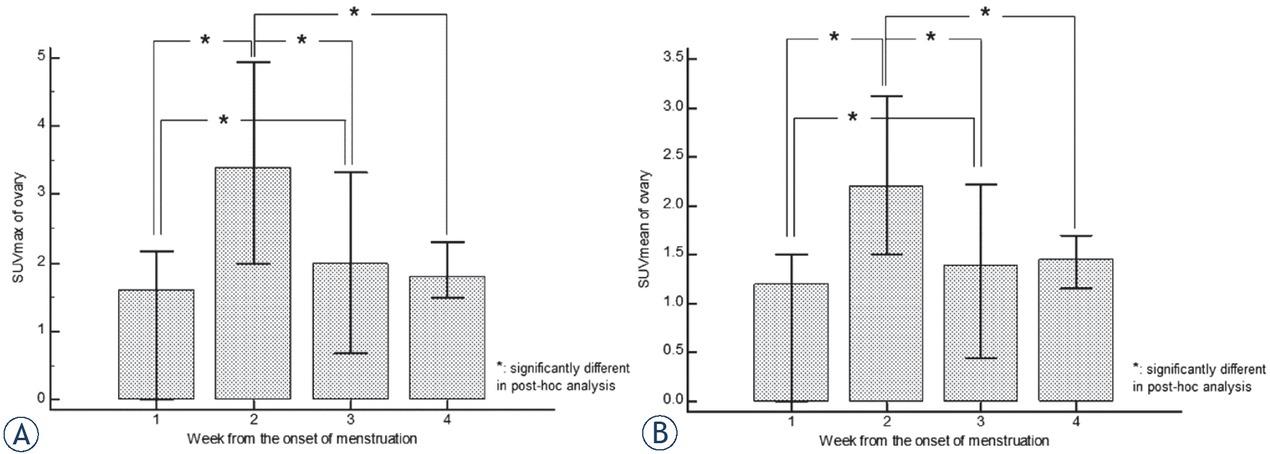
Figure 2
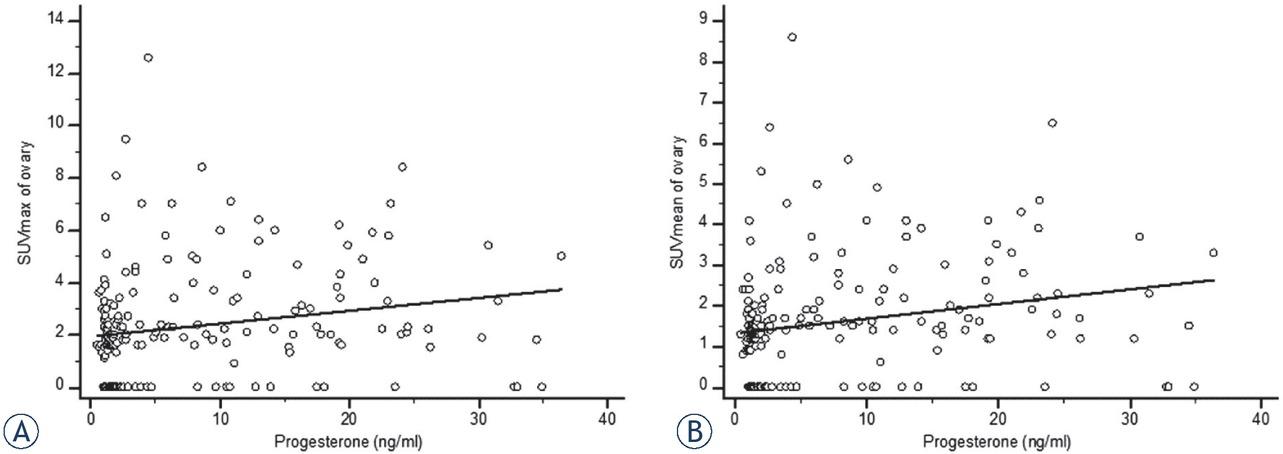
Correlation between ovarian 18F-FDG uptake and sex hormone levels
| Parameters | Follicular phase (n = 100) | Luteal phase (n = 97) | Total (N = 197) | ||||
|---|---|---|---|---|---|---|---|
| Spearman’s rho (95% CI) | p-value | Spearman’s rho (95% CI) | p-value | Spearman’s rho (95% CI) | p-value | ||
| Age | −0.15 (−0.34–0.04) | 0.125 | −0.06 (−0.26–0.13) | 0.500 | −0.14(−0.27–0.01) | 0.051 | |
| Estradiol Progesterone | Correlation with | 0.12 (−0.07–0.30) 0.29 (0.09–0.45) | 0.235 0.003* | −0.03 (−0.23–0.16) 0.13 (−0.07–0.32) | 0.721 0.131 | 0.05 (−0.08–0.19) 0.28 (0.14–0.40) | 0.426 <0.001* |
| Testosterone | SUVmax ovary of | −0.08 (−0.27–0.12) | 0.428 | 0.13 (−0.07–0.32) | 0.129 | 0.03 (−0.11–0.17) | 0.669 |
| FSH | -0.18 (−0.37 to −0.01) | 0.082 | 0.18 (−0.10–0.43) | 0.200 | −0.10 (−0.16 to −0.04) | 0.174 | |
| LH | 0.07 (−0.24–0.38) | 0.657 | −0.01 (−0.28–0.27) | 0.973 | −0.02 (−0.24–0.18) | 0.792 | |
| Age | −0.14 (−0.32–0.05) | 0.164 | −0.10 (−0.29–0.09) | 0.318 | −0.15 (−0.28–0.01) | 0.035* | |
| Estradiol | 0.09 (−0.09–0.29) | 0.324 | −0.06 (−0.26–0.13) | 0.532 | 0.03 (−0.10–0.17) | 0.601 | |
| Progesterone | Correlation with | 0.29 (0.09–0.46) | 0.003* | 0.16 (−0.04–0.35) | 0.161 | 0.30 (0.17–0.42) | <0.001* |
| Testosterone | SUVmean ovary of | −0.13 (-0.31–0.06) | 0.197 | 0.13 (−0.06–0.32) | 0.193 | 0.01 (−0.12–0.15) | 0.840 |
| FSH | −0.16 (−0.33–0.07) | 0.122 | 0.20 (−0.08–0.45) | 0.154 | −0.13 (−0.18 to −0.05) | 0.116 | |
| LH | −0.67 (−0.39–0.27) | 0.700 | 0.01 (−0.27–0.29) | 0.954 | −0.04 (−0.25–0.17) | 0.690 | |
Patient characteristics
| Menstrual phase on test day | ||||
|---|---|---|---|---|
| Follicular phase | Luteal phase | Total | p-value | |
| Number of patients, n (%) | 100 (50.8) | 97 (49.2) | 197 (100) | |
| Age, years | 45 (42–47) | 44 (38–47) | 44 (40–47) | 0.150 |
| Sex hormone levels | ||||
| Estradiol, pg/ml | 125 (76–176) | 150 (84–182) | 126 (81–179) | 0.292 |
| Progesterone, ng/ml | 1.62 (1.26–2.53) | 12.30 (3.85–18.95) | 2.71 (1.42–12.11) | < 0.001* |
| Testosterone, ng/ml | 0.34 (0.21–0.52) | 0.37 (0.23–0.51) | 0.36 (0.23–0.51) | 0.342 |
| FSH, mIU/ml | 5.7 (3.9–8.1) | 2.9 (1.7–4.1) | 3.7 (2.4–6.1) | < 0.001* |
| LH, mIU/ml | 5.9 (2.9–8.6) | 3.6 (2.5–6.6) | 4.6 (2.7–7.8) | 0.105 |
| SUVmax of ovary | 1.70 (0–2.70) | 2.10 (1.50–3.63) | 2.00 (0–3.23) | 0.030* |
| SUVmean of ovary | 1.30 (0-1.85) | 1.60 (0.9–2.40) | 1.40 (0–2.10) | 0.015* |