
Table 1
Summary of TNM guidelines for the staging of prostate cancer
| Category | Definition |
|---|---|
| Tumour | |
| Tx | Primary tumour cannot be assessed (e.g. CT study, severe artefacts on MRI) |
| T1a–T1b | Tumour incidental histologic finding |
| T1c | Tumour identified by needle biopsy but not visible by imaging |
| T2 | Organ confined disease |
| T2a | The tumour involves up to one half of 1 side of the prostate |
| T2b | The tumour involves more than one half of 1 side of the prostate |
| T2c | The tumour involves both sides of the prostate |
| T3 | Extraprostatic extension |
| T3a | Extraprostatic extension (unilateral or bilateral) or microscopic invasion of the bladder neck |
| T3b | Tumour invades seminal vesicle(s) |
| T4 | Tumour invades adjacent structures other than seminal vesicles, such as external sphincter, rectum, bladder, levator muscles, and/or pelvic wall |
| Node | |
| Nx | Regional lymph nodes were not assessed |
| N0 | No positive regional lymph nodes |
| N1 | Metastases in regional lymph node(s) |
| Metastasis | |
| Mx | M staging not assessed (e.g. MRI with pelvic only coverage) |
| M0 | No distant metastasis |
| M1 | Distant metastasis |
| M1a | Nonregional lymph node(s) |
| M1b | Bones |
| M1c | Other site(s) with or without bone disease |
Table 2
PI-RADS v2.1 recommended MR imaging protocols
| Imaging sequence | Technical parameters |
|---|---|
| Axial plane and a minimum of one additional | |
| T2 imaging | orthogonal plane (either sagittal or coronal) Straight axial plane to the patient or to the long axis of |
| the prostate | |
| FOV: 12-20 cm to image the entire prostate gland and | |
| seminal vesicles | |
| Section thickens/gap: 3 mm/0 mm | |
| In-plane resolution: ≤0.7 mm (phase) x ≤0.4 mm (frequency) | |
| DW imaging | Axial plane (same locations as for T2WI) |
| Free-breathing spin echo EPI sequence combined with spectral fat saturation is recommended | |
| Section thickness/gap: 3 mm/0 mm | |
| TE: ≤90 ms; TR: >3000 ms | |
| FOV: 16-22 cm | |
| In plane dimension: ≤2.5 mm phase and frequency | |
| ADC map calculation: low b-value should be set at 0 – 100 s/mm2, high b-value should be <1000 s/mm2 | |
| “High b-value”: b-value of ≥ 1400 sec/mm2; it can be acquired by scanning or calculated | |
| DCE | Axial plane (same locations as for T2WI) |
| Fat suppression and/or subtraction is recommended | |
| 2D or 3D T1 GRE sequence (preferred) | |
| Section thickness/gap: 3 mm/0 mm | |
| Injection rate: 2-3 ml/s | |
| TR/TE: <100 ms/ <5 ms | |
| In-plane dimension: ≤2mm X ≤2mm | |
| Temporal resolution: ≤15 s | |
| Total observation: >2min |
[i] 2D = two-dimensional; 3D = three-dimensional; ADC = apparent diffusion coefficient; EPI = echo planar imaging; DW = diffusion weighted; FOV = field of view; GRE = gradient echo T2W = T2 weighted; TE = echo time; TR = repetition time
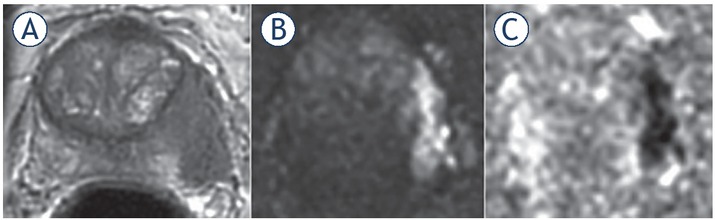
Figure 1
65-yr-old man with PSA 19.5 ng/ml. Invasion of the periprostatic fat and neurovascular bundle (NVB) infiltration at the left midgland consistent with T3a disease. Biopsy showed Gleason score (GS) 4 + 4 = 8. Radical retropubic prostatectomy (RRP) confirmed GS 4 + 4 = 8 and showed established T3a disease with a clear surgical margin (at least 1 mm).
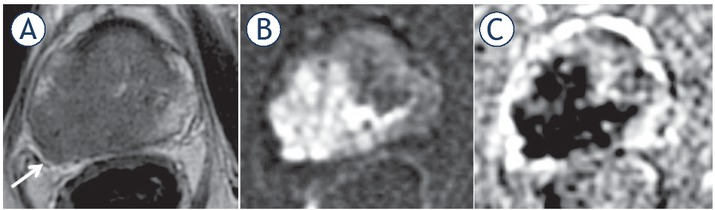
Figure 2
77-yr-old man with PSA 38.2 ng/ml. (A) T2 weighted (T2W) imaging; (B) diffusion weighted (DW) imaging: (C) apparent diffusion coefficient (ADC) map. T3a at the right mid gland with bulging and asymmetrical thickening of the right neurovascular bundle (arrow). Gleason score (GS) = 9 with extracapsular extension and clear surgical margins was confirmed at radical prostatectomy.
Table 3
PI-RADS v2 criteria for predicting extraprostatic extension
| Capsular abutment |
| Capsular irregularity, spiculation or retraction |
| Neurovascular bundle asymmetry or thickening |
| Obliteration of the rectoprostatic angle |
| Tumour-capsular contact > 10 mm |
| Bulge or loss of capsule |
| Measurable extracapsular disease |
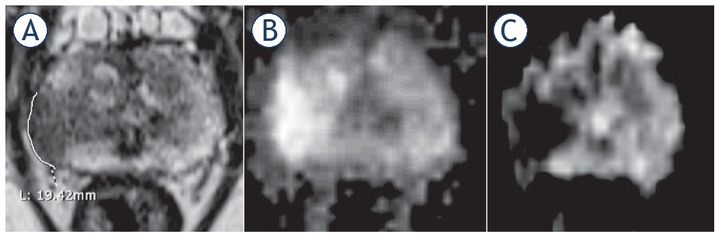
Figure 3
74-yr-old man with PSA 35.2 ng/ml. (A) T2 weighted (T2W) imaging, (B) diffusion weighted (DW) imaging, (C) apparent diffusion coefficient (ADC) map. T3a at the right mid gland as suggested by a broad capsular contact at 19.4 mm. Biopsy showed Gleason score (GS) 4 + 4 = 8 disease. Patient underwent radiotherapy.
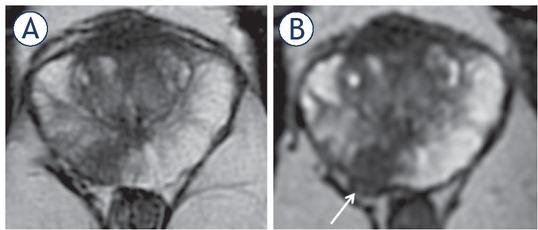
Figure 4
57-yr-old man with PSA 26 ng/ml. (A) Axial T2 weighted imaging (T2WI) shows mid gland right peripheral zones (PZ) lesion (arrow) with capsular contact but no tumour extension beyond it. (B) axial thin-sliced cube reformat suggests capsular breach and right neurovascular bundle involvement (arrow). Prostatectomy showed tumour in the right mid gland, Gleason score 4 + 5 = 9, with established extracapsular extension (ECE) (pT3a).
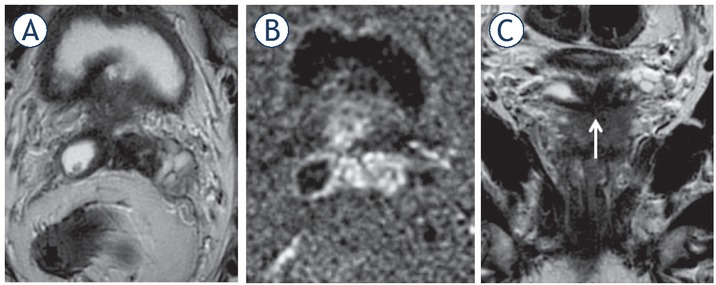
Figure 5
65-yr-old-man with PSA = 15.3 ng/ml and Gleason score 4 + 4 = 8 at biopsy. Axial (A) and coronal (C) T2 weighted imaging (T2WI) and diffusion weighted imaging (DWI) (B). T3b involving both seminal vesicles via ejaculatory ducts, shown in the coronal plane (arrow).
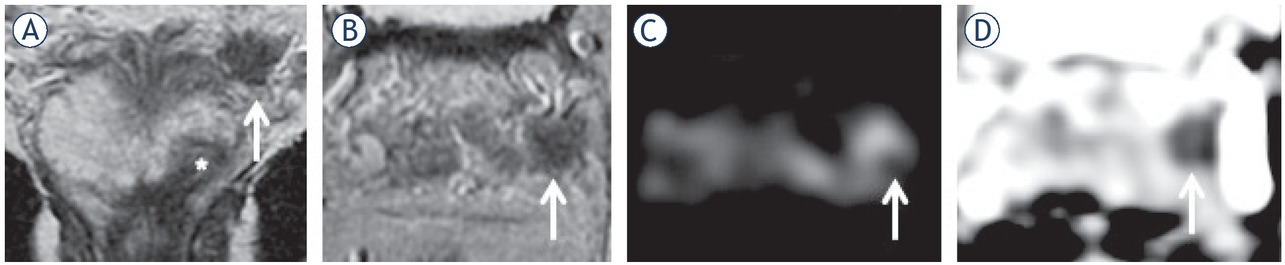
Figure 6
67-yr-old man with raising PSA = 12.7 ng/ml. (A) (coronal) and (B) (axial) T2 weighted (T2W) imaging shows index lesion in the left apex (*) and a low signal focus in the left seminal vesicle (arrow) with corresponding restricted diffusion on diffusion weighted imaging (DWI) ((C); arrow) and apparent diffusion coefficient (ADC) map ((D); arrow).

Figure 7
55-yr-old-man with PSA 32 ng/ml. (A) T2 weighted (T2W) imaging, (B) T1 weighted (T1W) imaging, (C) diffusion weighted (DW) imaging, (D) apparent diffusion coefficient (ADC) map. Low T2 signal in the right seminal vesicle is mimicking prostate cancer (D), however, there is no restricted diffusion. Biopsy of the right seminal vesicle showed amyloidosis which was confirmed at radical prostatectomy. Index tumour with Gleason score 4 + 3 = 7 was in the left peripheral zone.
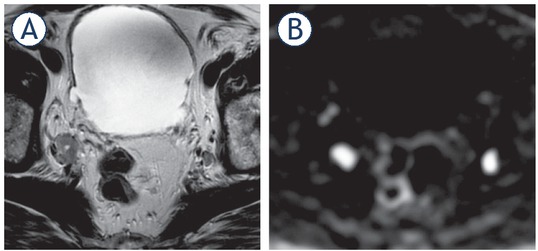
Figure 8
77-yr-old man with PSA = 38.2 ng/ml. Enlarged nodes bilaterally consistent with metastatic involvement on T2 weighted imaging (T2WI) (A), more conspicuous on diffusion weighted imaging (DWI) (B).
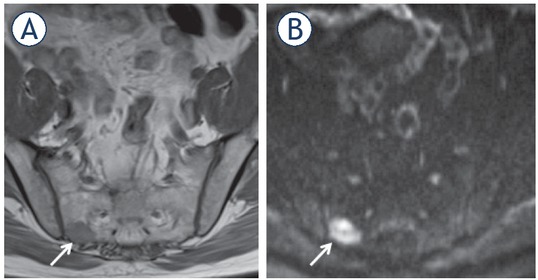
Figure 9
61-yr-old man with PSA = 12.7 ng/ml. Bone metastasis (arrow) in the right sacrum shown as low signal on T1 weighted (T1W) imaging (A); more conspicuous as high signal on diffusion weighted imaging (DWI) (B).