
Figure 1
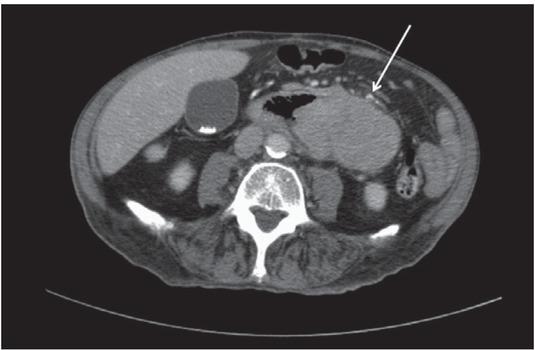
Figure 2
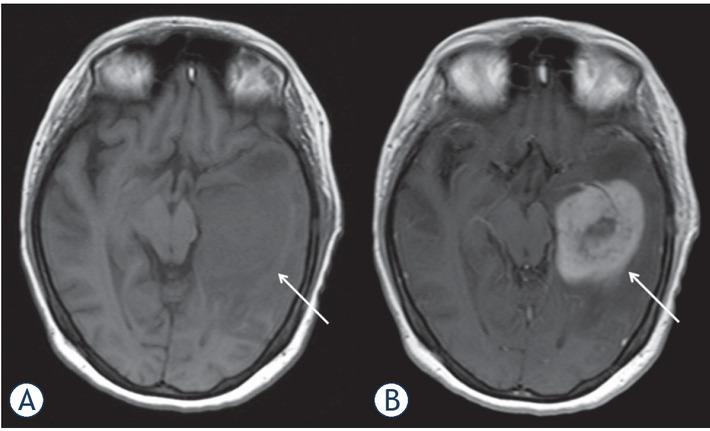
Figure 3
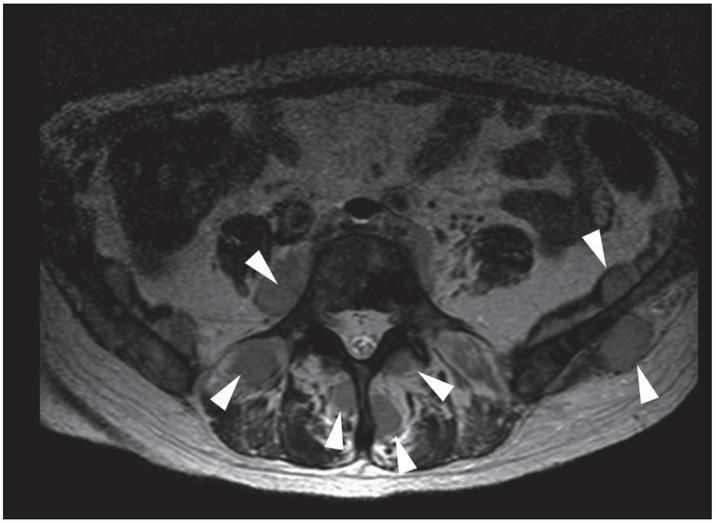
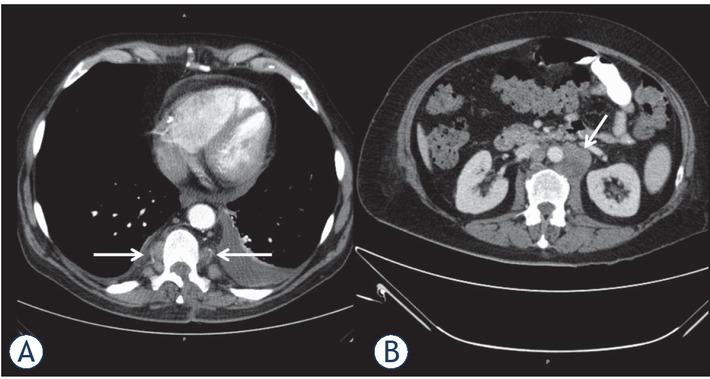
Figure 4
The affected body regions of the patients
| Region | N | % |
|---|---|---|
| Visceral soft tissue | 26 | 29.9 |
| Cutis | 21 | 24.1 |
| Bones | 13 | 14.9 |
| Central nervous system | 9 | 10.3 |
| Lymph nodes | 4 | 4.6 |
| Stomach | 3 | 3.4 |
| Pancreas | 3 | 3.4 |
| Heart | 2 | 2.3 |
| Enteric | 2 | 2.3 |
| Testis | 1 | 1.2 |
| Breast | 1 | 1.2 |
| Bladder | 1 | 1.2 |
| Kidney | 1 | 1.2 |
| All | 87 | 100 |