
Figure 1
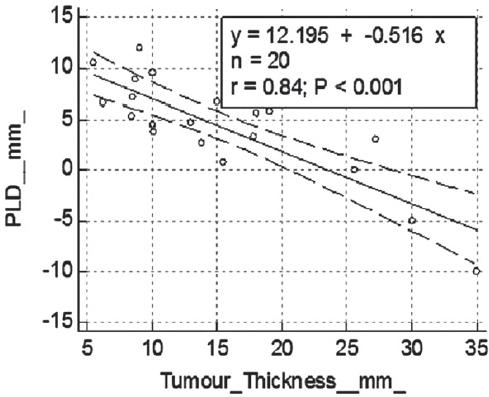
Figure 2
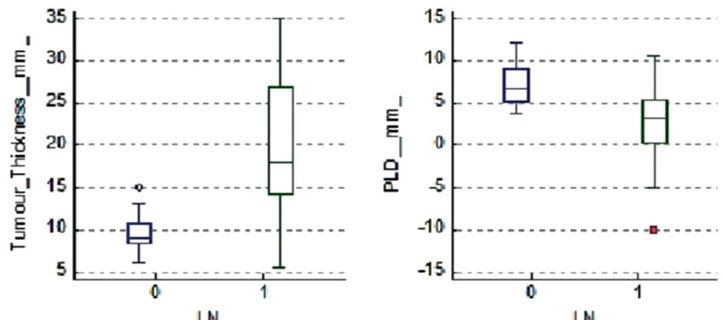
Figure 3
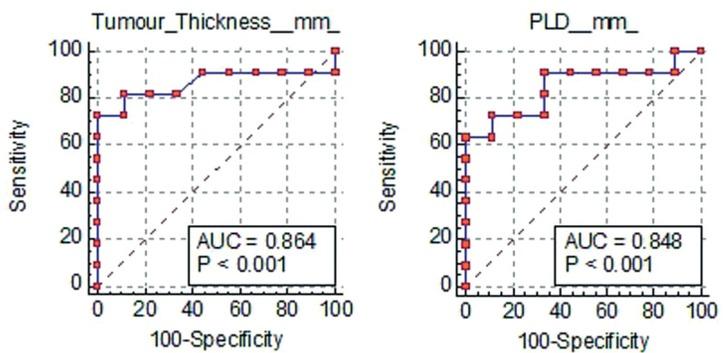
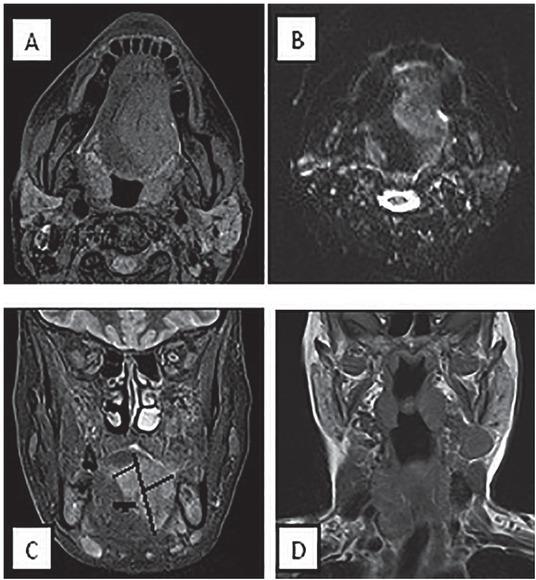
Figure 4
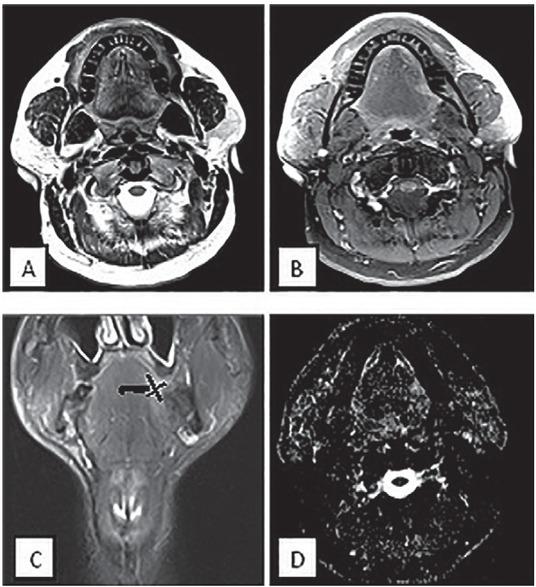
Figure 5
Logistic regression analysis for independent variables predicting LN spread
| P value | R2 | Odds Ratio | 95% CI | |
|---|---|---|---|---|
| Age | 0.926 | 0.0005 | 1.004 | 0.917 to 1.099 |
| Tumour Thickness | <0.0001** | 0.755 | 1.756 | 1.075 to 2.866 |
| Para-lingual distance | 0.0001** | 0.697 | 0.325 | 0.107 to 0.982 |
| ADC | 0.472 | 0.023 | 1.003 | 0.995 to 1.015 |
Absolute values for TT, PLD and ADC for (N0) and (N1) LN spread
| N0 | ||
|---|---|---|
| TT (mm) | PLD (mm) | ADC |
| 10 | 9.5 | 0.899 |
| 8.4 | 5.3 | 0.937 |
| 15 | 6.7 | 0.815 |
| 8.7 | 8.9 | 0.953 |
| 10.1 | 3.8 | 1.051 |
| 5.5 | 10.5 | 0.875 |
| 6.2 | 6.6 | 0.988 |
| 9 | 12 | 0.836 |
| 13 | 4.7 | 0.864 |
| 8.5 | 7.2 | 0.955 |
| 9.8 | 10 | 0.832 |
| 9 | 7.8 | 0.968 |
| 12.3 | 6.3 | 0.843 |
| 7.6 | 9.2 | 0.915 |
| 10.7 | 4.3 | 1.31 |
| 6.3 | 10.8 | 0.864 |
| 6.4 | 6.7 | 0.978 |
| 9.3 | 12.4 | 0.834 |
| 9.1 | 7.9 | 0.869 |
| 10 | 9.5 | 0.899 |
| 8.4 | 5.3 | 0.937 |
| 8.7 | 8.9 | 0.953 |
| N1 | ||
| 19 | 5.8 | 1.18 |
| 17.8 | 3.3 | 0.928 |
| 10 | 4.5 | 1.16 |
| 15.5 | 0.8 | 0.795 |
| 13.8 | 2.7 | 0.961 |
| 18 | 5.6 | 0.793 |
| 16.9 | 3.1 | 0.874 |
| 12.3 | 4.7 | 1.17 |
| 13.7 | 0.5 | 0.778 |
| 14.8 | 3.7 | 0.959 |
| 19 | 5.8 | 1.18 |
| 17.8 | 3.3 | 0.928 |
| 15 | 6.7 | 0.815 |
| 13.8 | 4.4 | 0.83 |
| 35 | -10 | 0.987 |
| 27.2 | 3.1 | 1.03 |
| 30 | -5 | 0.976 |
| 25.6 | 0 | 0.892 |
| 34 | -8 | 0.984 |
| 25 | 7 | 1.21 |
| 23.2 | 3.2 | 1.07 |
| 29.7 | -3 | 0.938 |
| 22.8 | 0 | 0.792 |
| 21.4 | 5.8 | 0.724 |
| 27.8 | -7 | 0.852 |
| 23.9 | 0 | 0.897 |
| 42.7 | -15 | 0.893 |
| 43.2 | -12 | 1.051 |
Summary of descriptive statistics for studied population
| N | N1 | N0 | P value | |
|---|---|---|---|---|
| Age (mean+/-SD) | 61 ± 10 | 61 ± 11 | 60 ± 9 | 0.794 |
| Sex (male, no., %) | 34/50 (68%) | 20/28 (71%) | 14/22 (64%) | _ |
| Tumour Thickness (mean+/-SD) | 16.62 ± 9.45 | 19.8 ± 8.8 | 9.9 ± 2.6 | 0.008* |
| Para-lingual distance (mean+/-SD) | 3.8 ± 5.12 | 0.9 ± 5.5 | 7.2 ± 2.5 | 0.003* |
| ADC (mean+/-SD) | 0.944 ± 0.124 | 0.952 ± 0.112 | 0.928 ± 0.118 | 0.518 |