
Figure 1
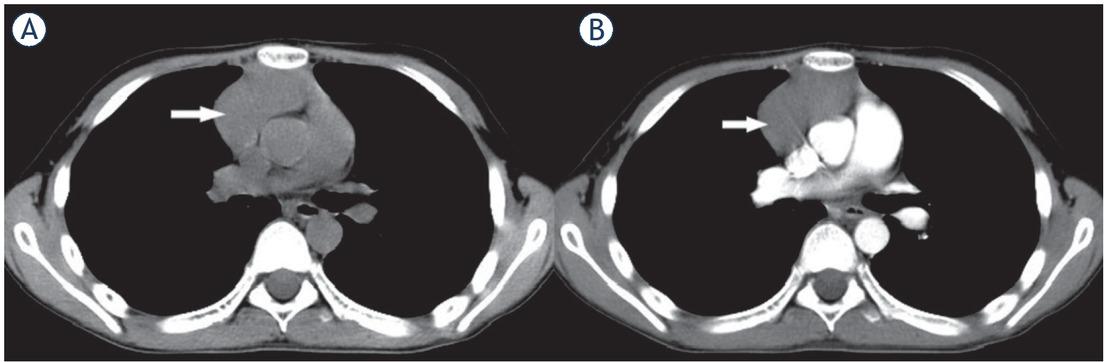
Figure 2
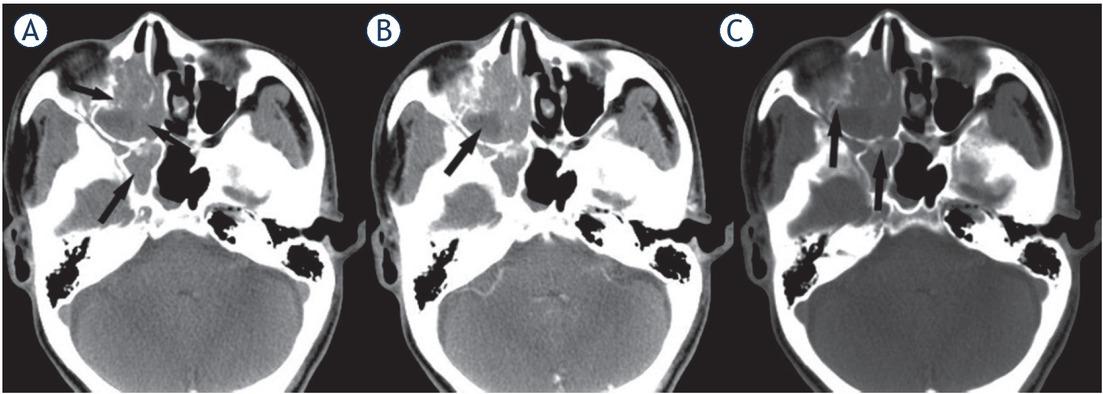
Figure 3
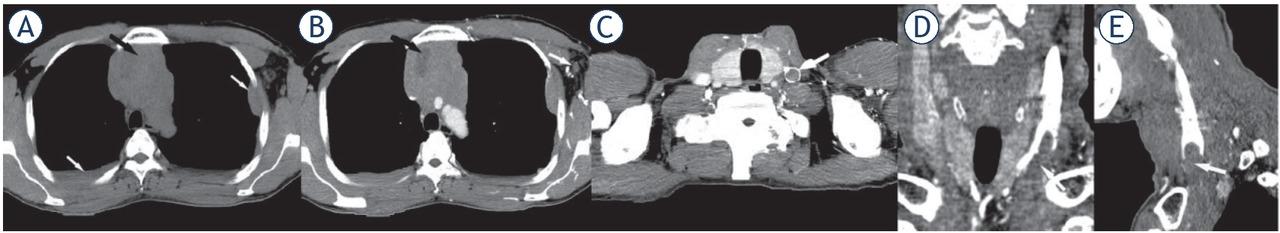
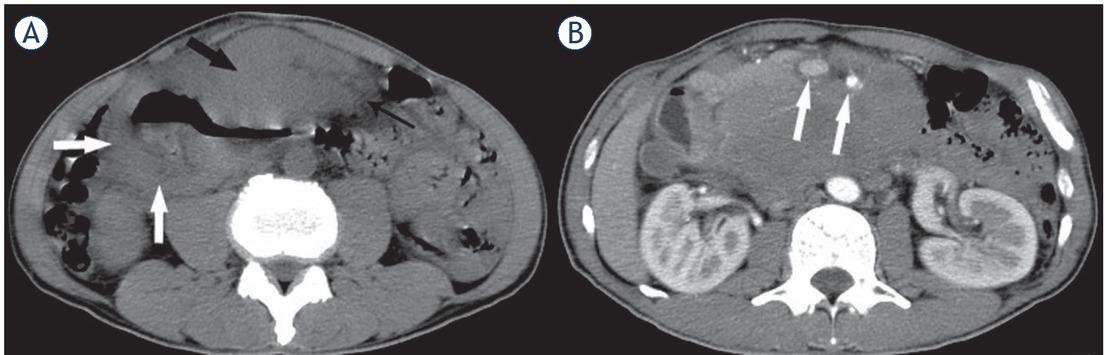
Figure 4
Clinical characteristics of 51 patients with PTCL
| Characteristics | Number of cases | Percentage(%) |
|---|---|---|
| Gender | ||
| Male | 32 | 62.7 |
| Female | 19 | 37.3 |
| Age(y) | 47.8 ± 19.1 (range, 9–83) | |
| Histology | ||
| PTCL-NOS | 27 | 52.9 |
| ALCL ALK+ | 8 | 13.7 |
| ALCL ALK- | 7 | 15.7 |
| AITL | 9 | 17.6 |
| Ann Arbor stage | ||
| I-II | 21 | 41.2 |
| III- IV | 30 | 58.8 |
| Clinical outcome | ||
| Progression or relapse within 24 months | 27 | 52.9 |
| No evidence of relapse within 24 months | 24 | 47.1 |
CT findings of 51 patients with PTCL
| Characteristics | Number of cases | Percentage(%) |
|---|---|---|
| Involvement site | ||
| Single | 27 | 52.9 |
| Multiple | 24 | 47.1 |
| Tumor size(cm) | 6.0 ± 2.4 (range, 1.5–14.0) | |
| Tumor margin | ||
| Well-defined | 29 | 56.9 |
| Ill-defined with peritumoral invasion | 22 | 43.1 |
| Tumor shape | ||
| Round/oval | 17 | 33.3 |
| Irregular | 34 | 66.7 |
| Tumor density | ||
| Homogenous | 28 | 54.9 |
| Heterogeneous | 23 | 45.1 |
| Intratumoral necrosis | ||
| Present | 14 | 27.5 |
| Absent | 37 | 72.5 |
| Enhancement degree | ||
| Mild | 21 | 41.2 |
| Moderate | 30 | 58.8 |
| Lymph node involvement | ||
| Present | 32 | 62.7 |
| Absent | 19 | 37.3 |
Univariate analyses of CT findings
| Factor | Category | Number of good vs poor outcomes | P value |
|---|---|---|---|
| Involvement site | 0.016* | ||
| Single | 17:10 | ||
| Multiple | 7:17 | ||
| Tumor size | 0.328 | ||
| < 6.0cm | 14:13 | ||
| ≥ 6.0cm | 10:14 | ||
| Ill-defined margin with peritumoral invasion | < 0.001* | ||
| Present | 4:18 | ||
| Absent | 20:9 | ||
| Tumor shape | 0.617 | ||
| Round/oval | 8:9 | ||
| Irregular | 16:18 | ||
| Inhomogenous density | 0.001* | ||
| Present | 5:18 | ||
| Absent | 19:9 | ||
| Intratumoral necrosis | 0.025* | ||
| Present | 3:11 | ||
| Absent | 21:16 | ||
| Enhancement degree | 0.586 | ||
| Mild | 10:11 | ||
| Moderate | 14:16 | ||
| Lymph node involvement | 0.069 | ||
| Present | 12:20 | ||
| Absent | 12:7 |
Multivariate analyses of CT findings
| Factor | Odd ratio | 95% CI | P value |
|---|---|---|---|
| Involvement site | 3.499 | 0.766–15.987 | 0.106 |
| Ill-invasion defined margin with peritumoral | 7.749 | 1.567–38.315 | 0.012* |
| Inhomogenous density | 2.356 | 0.324–17.116 | 0.397 |
| Intratumoral necrosis | 3.157 | 0.253–39.370 | 0.372 |