
Figure 1
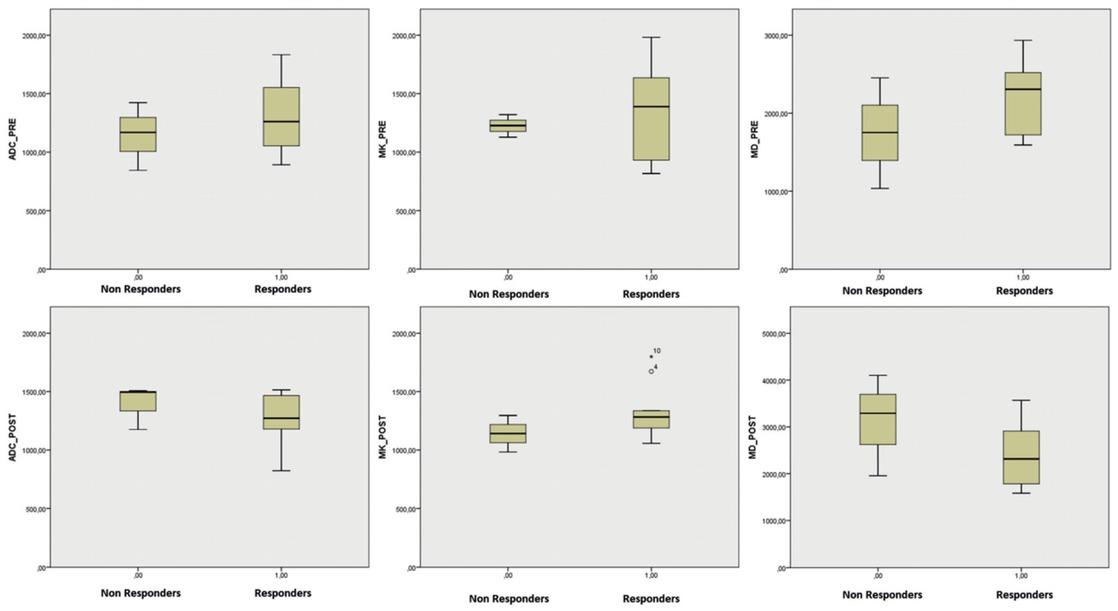
Figure 2
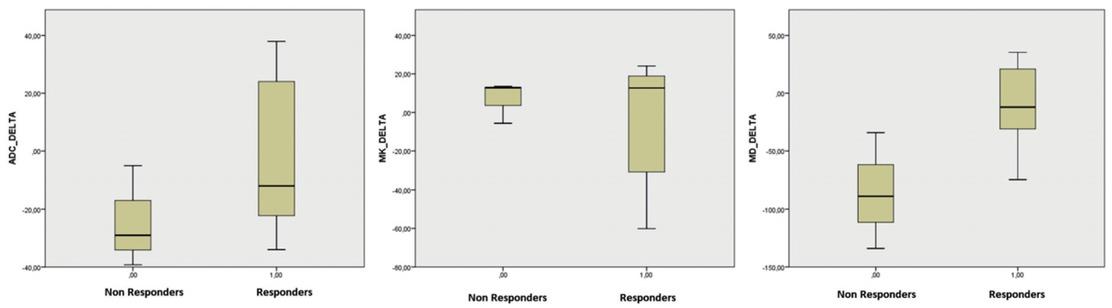
Figure 3
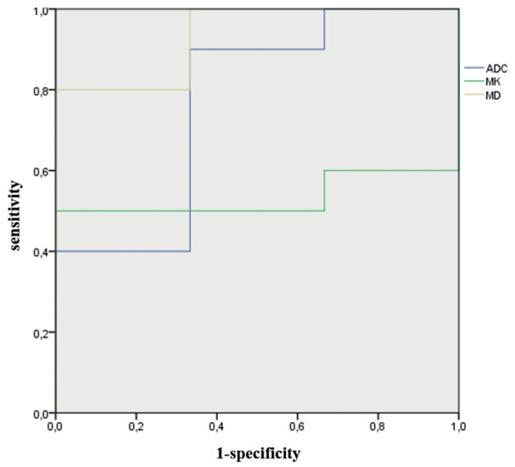
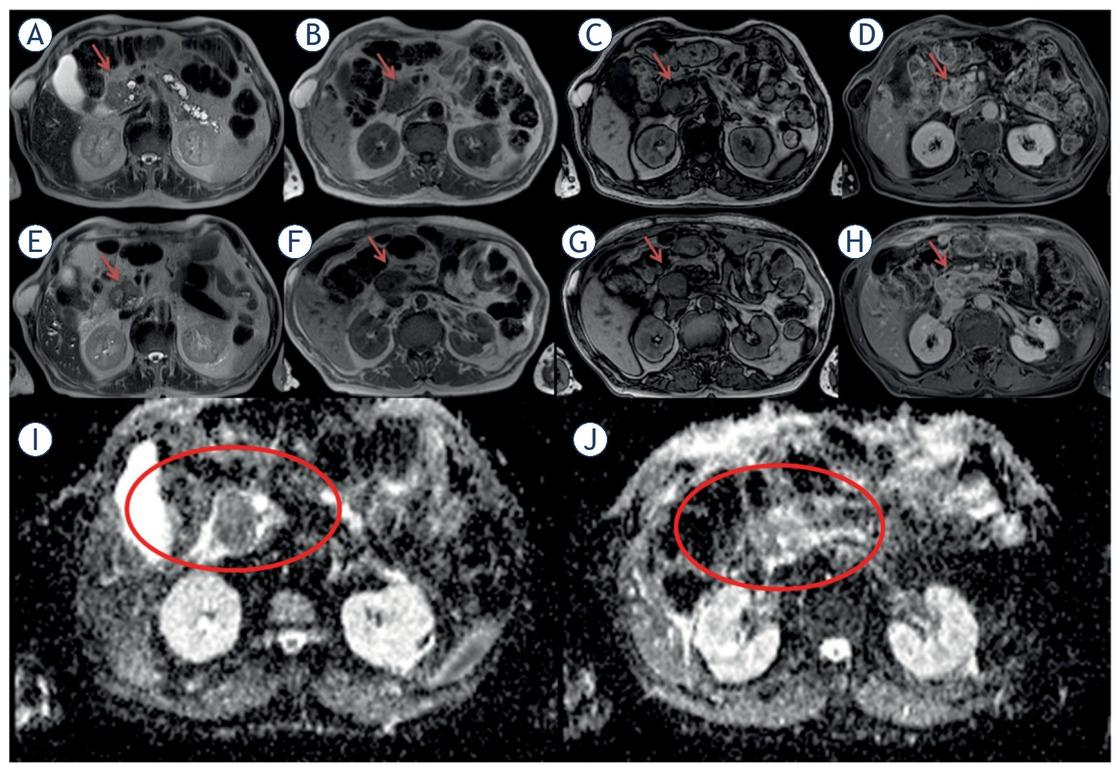
Figure 4
MRI protocol parameters
| Sequence | Orientation | TR/TE/FA (ms/ms/deg.) | FOV (mm2) | Acquisition matrix | Slice thickness/ gap (mm) |
|---|---|---|---|---|---|
| HASTE T2-W | Axial | 1500/90/180 | 380 × 380 | 320 × 320 | 5/0 |
| FLASH T1-W, In-out phase | Axial | 160/4.87/70 | 285 × 380 | 192 × 256 | 5/0 |
| FLASH T1-W, out phase | Axial | 178/2.3/80 | 325 × 400 | 416 × 412 | 3/0 |
| DWI | Axial | 7500/91/90 | 340 × 340 | 192 × 192 | 3/0 |
| VIBE T1-W | Axial | 4.89/2.38/10 | 325 × 400 | 320 × 260 | 3/0 |
| TWIST T1-W, Pre and post contrast agent injection | Axial | 3.01/1.09/25 | 300 × 300 | 256 × 256 | 2/0 |
Electrochemotherapy (ECT) response classification for each patient
| No. | CT response according Choi | DCE-MRI response according ΔWIS and ΔWOS | PET response according PERCIST | Consenssus among two modalities |
|---|---|---|---|---|
| 1 | PR | PR | PD | PR |
| 2 | PR | PR | PR | |
| 3 | PR | PR | PR | PR |
| 4 | PR | PR | PR | |
| 10 | PR | CR | PR | |
| 11 | PR | SD | PR | SD |
| 12 | SD | PR | SD | SD |
| 13 | PR | SD | PR | PR |
| 14 | PR | PR | PR | PR |
| 17 | PR | PR | SD | PR |
| 18 | PR | PR | SD | PR |
| 19 | PR | PR/SD | PR | PR |
| 20 | PR | PR | PR | |
| 21 | SD | SD | SD |
Diagnostic accuracy of MRI extracted parameters in discrimination of responders and not responders_
| AUC | 95% CI | p value | Sensitivity | Specificity | Cut-off | |
|---|---|---|---|---|---|---|
| ΔADC | 0,767 | 0,429–1,00 | 0,176 | 0,900 | 0,667 | -25,775 |
| ΔMK | 0,533 | 0,229–0,837 | 0,866 | 0,500 | 1,000 | 14,555 |
| ΔMD | 0,933 | 0,782–1,000 | 0,028 | 0,800 | 1,000 | -32,570 |
| ADC PRE | 0,667 | 0,292–1,000 | 0,398 | 0,700 | 0,667 | 1182,550 |
| MK PRE | 0,667 | 0,380–1,953 | 0,398 | 0,600 | 1,000 | 1348,700 |
| MD PRE | 0,700 | 0,360–1,000 | 0,310 | 0,400 | 1,000 | 2477,500 |
| ADC POST | 0,367 | 0,000–0,766 | 0,499 | 0,800 | 0,333 | 1177,825 |
| MK POST | 0,800 | 0,505–1,000 | 0,128 | 0,500 | 1,000 | 1299,075 |
| MD POST | 0,267 | 0,000–0,602 | 0,237 | 0,600 | 0,333 | 2020,725 |
Patients’ characteristics
| Patients (n = 21) | |
|---|---|
| Histotype, % | |
| Adenocarcinoma | 100 (21/21) |
| Location, % | |
| Head | 52.4 (11/21) |
| Body/tail | 47.6 (10/21) |
| Largest diameter lesion, cm (range) | 5.2 (2.2–9.9) |
| Venus involvement (superior mesenteric vein [SMV] or portal vein [PV]), % | |
| Yes | 81.0 (17/21) |
| No | 19.0 (4/21) |
| Arterial encasement, % | |
| Yes | 57.1 (12/21) |
| No | 42.9 (9/21) |