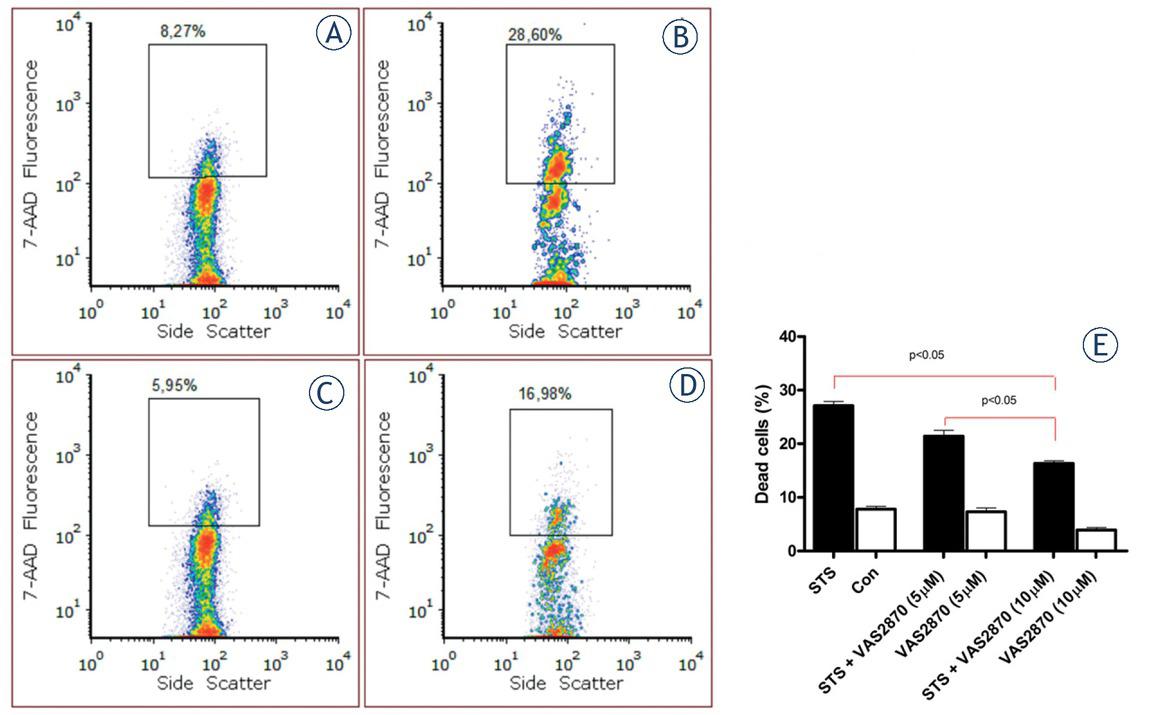
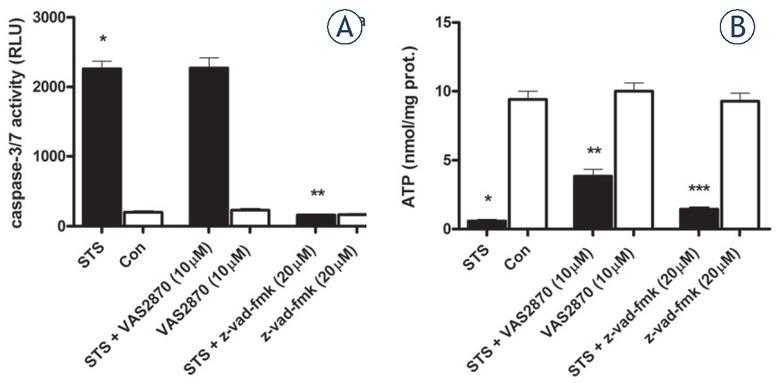
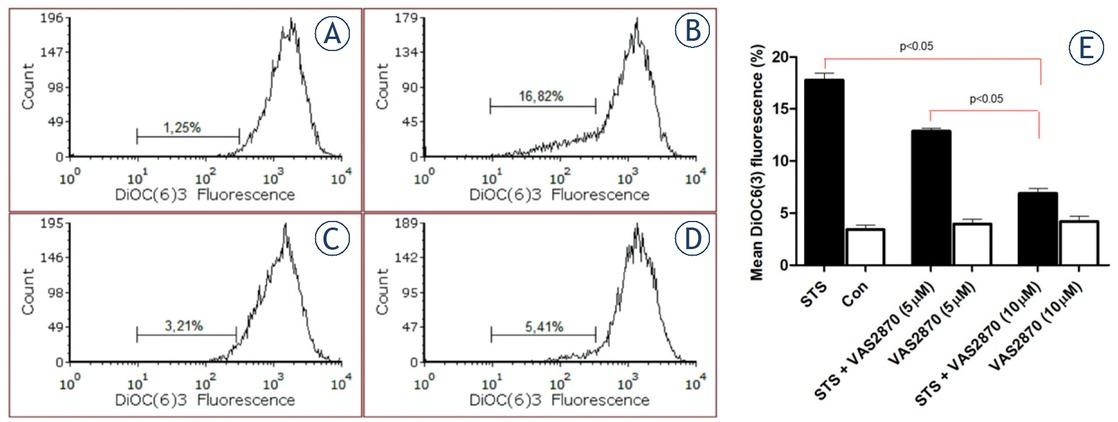
Have a personal or library account? Click to login
NADPH oxidase inhibitor VAS2870 prevents staurosporine-induced cell death in rat astrocytes Cover

NADPH oxidase inhibitor VAS2870 prevents staurosporine-induced cell death in rat astrocytes

Open Access
|Jan 2019

Figures & Tables

Figure 1

The effect of staurosporine on viability of rat astrocytes. Representative flow cytometric experiment is showing the uptake of 7-AAD vital dye in rat astrocytes. The percentages of dead cells with high red fluorescence intensity are shown in rectangular regions. (A) The control cells were not treated. (B) The cells were exposed to 1 μM staurosporine. (C) The cells were exposed to 10 μM VAS2870. (D) The cells were pre-treated with 10 μM VAS2870 and exposed to 1 μM staurosporine. (E) The percentages of dead cells as determined by 7-AAD uptake. (Con) The control cells were not treated. (STS) The cells were exposed to 1 μM staurosporine. (STS+VAS2870) The cells were pre-treated with 5 or 10 μM VAS2870 and exposed to 1 μM staurosporine. (VAS2870) The cells were exposed to 5 or 10 μM VAS2870. Data were analysed using one-way ANOVA and a Tukey multiple comparison test; p < 0.05 indicates significance.

Figure 2

(A) The effect of staurosporine on caspases-3/7 activation and (B) level of intracellular ATP. (STS) The cells were exposed to 1 μM staurosporine. (Con) The control cells were not treated. (STS+VAS2870) The cells were pre-treated with 10 μM VAS2870 and exposed to 1 μM staurosporine. (VAS2870) The cells were exposed to 10 μM VAS2870. (STS + z-vad-fmk) The cells were pre-treated with 20 μM z-vad-fmk and exposed to 1 μM staurosporine. (z-vad-fmk) The cells were exposed to 20 μM z-vad-fmk. Data were analysed using one-way ANOVA and a Tukey multiple comparison test; *p < 0.05 vs. Con, **p < 0.05 vs. STS, ***p < 0.05 vs STS + VAS2870 indicate significance. RLU- relative luminescence units.

Figure 3

Representative flow cytometric experiment is showing detection of ROS production in rat astrocytes after staurosporine activation. The percentages of cells with high DCF fluorescence intensity are shown in rectangular regions. (A) Untreated control cells. (B) The cells were exposed to 1 μM staurosporine. (C) The cells were exposed to 10 μM VAS2870. (d) The cells were pre-treated with 10 μM VAS2870 and exposed to 1 μM staurosporine. (E) Production of ROS, detected as the percentage of cells with high DCF fluorescence intensity. (STS) The cells were exposed to 1 μM staurosporine. (Con) Untreated control cells. (STS + VAS2870) The cells were pre-treated with 5 or 10 μM VAS2870 and exposed to 1 μM staurosporine. (VAS2870) The cells were exposed to 5 or 10 μM VAS2870. Data were analysed using one-way ANOVA and a Tukey multiple comparison test; p < 0.05 indicates significance.

Figure 4

A representative flow cytometric experiment is showing the DiOC6(3) fluorescence intensity in rat astrocytes. The markers show the percentage of cells with reduced mitochondrial potential. (A) Untreated control cells. (B) The cells were exposed to 1 μM staurosporine. (C) The cells were exposed to 10 μM VAS2870. (D) The cells were pre-treated with 10 μM VAS2870 and exposed to 1 μM staurosporine. (E) The reduction of mitochondrial potential, detected as the percentage of low DiOC6(3) fluorescence. (STS) The cells were exposed to 1 μM staurosporine. (Con) Untreated control cells. (STS+VAS2870) The cells were pre-treated with 5 or 10 μM VAS2870 and exposed to 1 μM staurosporine. (VAS2870) The cells were exposed to 5 or 10 μM VAS2870. Data were analysed using one-way ANOVA and a Tukey multiple comparison test; p < 0.05 indicates significance.
DOI: https://doi.org/10.2478/raon-2019-0002 | Journal eISSN: 1581-3207 | Journal ISSN: 1318-2099
Language: English
Page range: 69 - 76
Submitted on: Sep 24, 2018
|
Accepted on: Nov 18, 2018
|
Published on: Jan 19, 2019
In partnership with: Paradigm Publishing Services
Publication frequency: 4 issues per year

© 2019 Janez Simenc, Damijana Mojca Juric, Metoda Lipnik-Stangelj, published by Association of Radiology and Oncology
This work is licensed under the Creative Commons Attribution-NonCommercial-NoDerivatives 3.0 License.